


Context switching is a true drag on productivity, and it slows down the pace at which platform engineers/administrators can operate their infrastructure and application stacks. Portworx has built an OpenShift Dynamic console plugin that enables single-pane-of-glass management of storage resources running on Red Hat OpenShift clusters. This allows platform administrators to use the OpenShift web console to manage not just their applications and their OpenShift cluster, but also their Portworx installation and their stateful applications running on OpenShift.
In this blog, we will talk about how users can leverage the OpenShift Dynamic plugin from Portworx to monitor different storage resources running on their OpenShift clusters. The Portworx plugin can be enabled by simply installing (greenfield) or upgrading (brownfield) the Portworx Operator to 23.5.0 or higher release on OpenShift 4.12 clusters. Once the Portworx Operator is installed, the plugin can be easily enabled by selecting a radio button from the OpenShift web console.
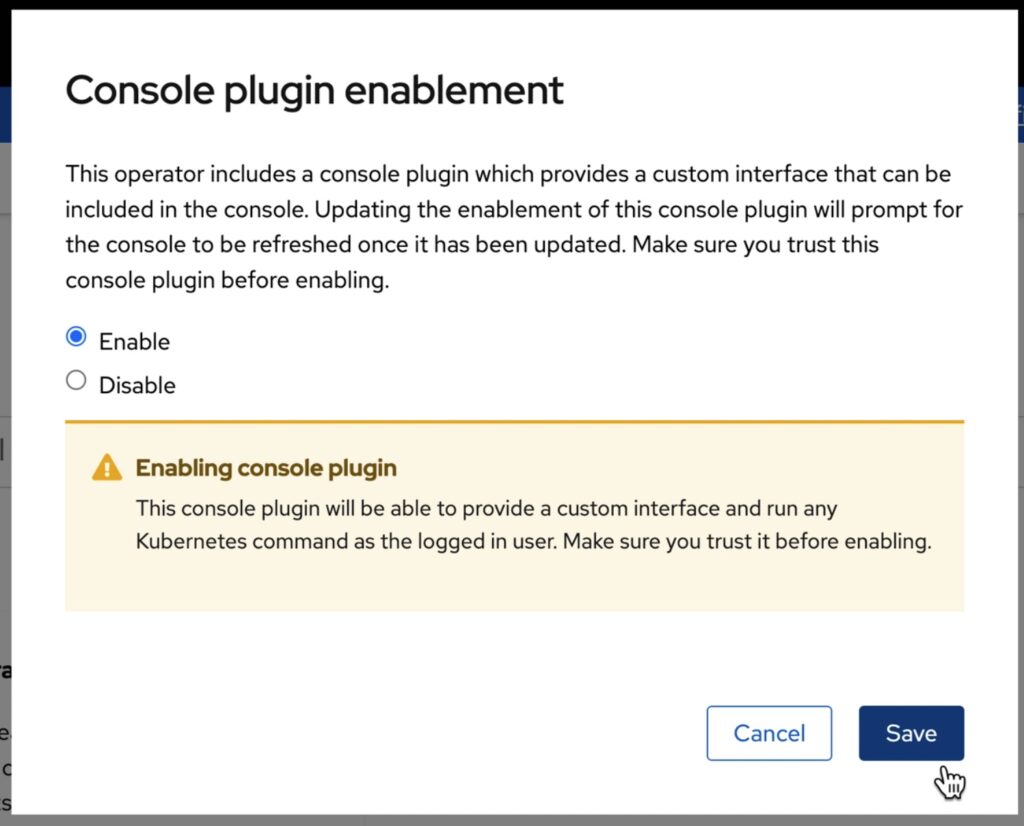
Figure 1: Enabling the OpenShift Dynamic Console plugin
Once the plugin is enabled, the Portworx Operator will automatically install the plugin pods in the same OpenShift project as the Portworx storage cluster. Once the pods are up and running, administrators will see a message in the OpenShift web console to refresh their browser window for the Portworx tabs to show up in the UI.
With this plugin, Portworx has built three different UI pages, including a Portworx Cluster Dashboard that shows up in the left navigation menu, a Portworx tab under Storage –> Storage Class section, and another Portworx tab under Storage –> Persistent Volume Claims section.
The Portworx Cluster Dashboard can be used by platform administrators to monitor the status of their Portworx Storage Cluster and their persistent volumes and storage nodes. Here are a few operations that are now streamlined by the OpenShift Dynamic plugin from Portworx.
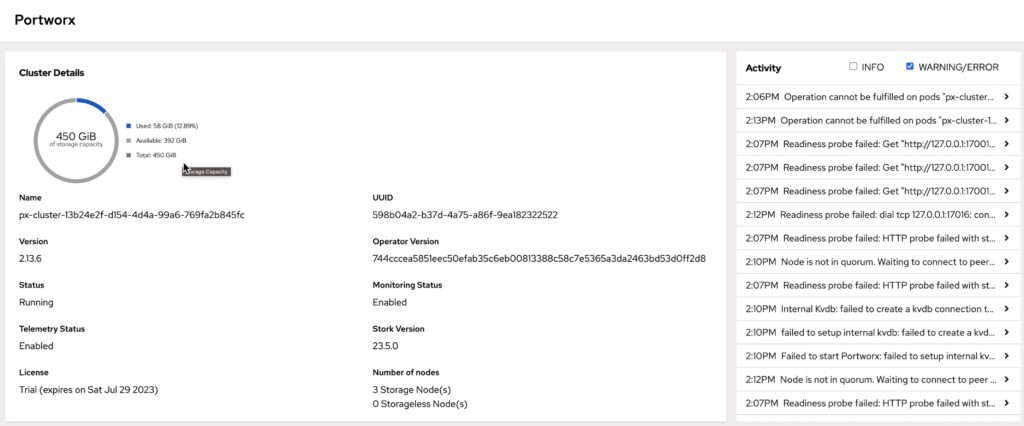
Figure 2: Portworx Storage Cluster dashboard
Storage Capacity Management: Using the cluster details widget, administrators can quickly get an overview of their used vs available storage capacity on their OpenShift cluster. This allows them to better plan their storage expansion operations so they don’t run out of capacity for their stateful applications running on OpenShift.
License Management: Using the cluster details widget, administrators can always stay on top of their license expiration, allowing them to easily plan for renewals.
Component Versions: Using the cluster details widget, administrators can get an overview of the different versions of Portworx, Operator, and Stork they have running on their OpenShift cluster—instead of having to log into the CLI and fetch the same information using different kubectl/oc/pxctl commands.
Observability: Using the activities widget, administrators can get a recap of all the storage-specific Kubernetes events—categorized as “Info” and “Warning/Error” events. This allows them to keep track of what’s going on in their OpenShift clusters without having to use the CLI and context switch. Administrators can expand individual events to get more details about a specific event, which can speed up root cause analysis if there are any issues.
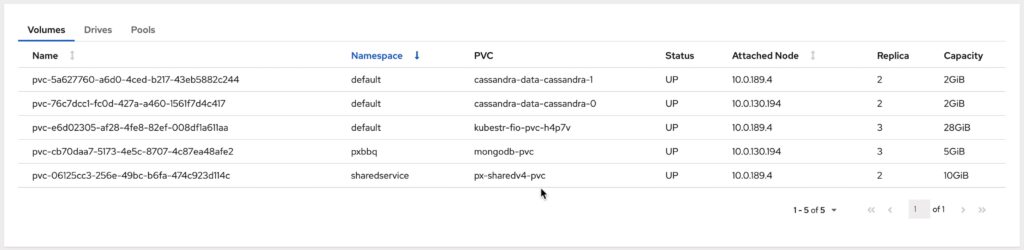
Figure 3: Portworx Persistent Volumes table
Volume Management: Instead of going to the CLI and executing Get-Commands to fetch the status of persistent volumes running across different Kubernetes namespaces, administrators can use the “Volumes” table to get an overview of their volume—sorted by different Kubernetes namespaces. This table also highlights the worker node the volume is running on, the number of replicas that exist for that volume, and the amount of capacity provisioned for that volume.
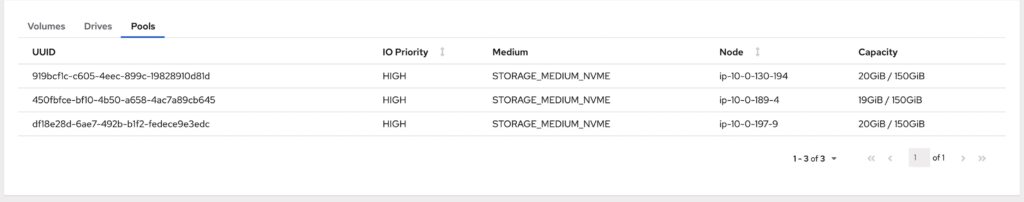
Figure 4: Portworx Storage pools table
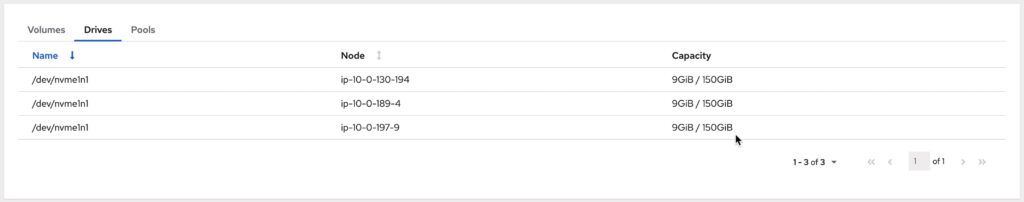
Figure 5: Portworx drives table
Drive and Storage Pool Management: Portworx allows administrators to have multiple drives backing the cloud-native/software-defined layer, as well as allowing them to create different storage pools based on different media types for these backing drives. Instead of navigating to the CLI and executing a series of “pxctl” commands to get details about their storage pools and backing drives, the Portworx Cluster Dashboard allows administrators to get that information from a couple of simple tables that can be sorted by individual worker nodes that contribute storage to the Portworx StorageCluster.
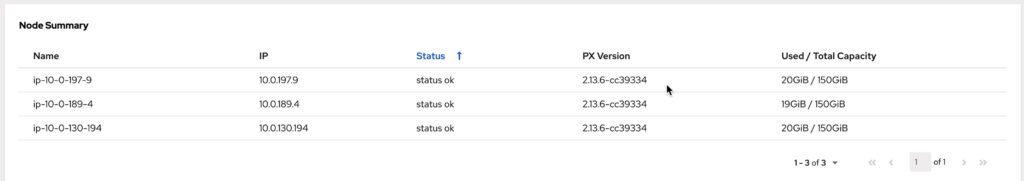
Figure 6: Portworx Storage Nodes table
Storage Node Management: Portworx can be installed in a hyperconverged or a disaggregated deployment model, which means any OpenShift cluster can have all their worker nodes running as storage nodes or only a subset of their worker nodes running as storage nodes, respectively. The Node Summary Table allows administrators to monitor their storage nodes in the cluster, see how storage is distributed across different nodes, and identify issues such as offline or unbalanced nodes.
Portworx allows platform administrators to create custom Kubernetes StorageClasses to offer different classes of service to their developers. Administrators can customize things like the replication factors, snapshot schedules, file system types, io-profiles, etc. in their storage class definitions. Developers can then choose to use a different storage class for their test/dev workloads and a different storage class for their production applications and so on.
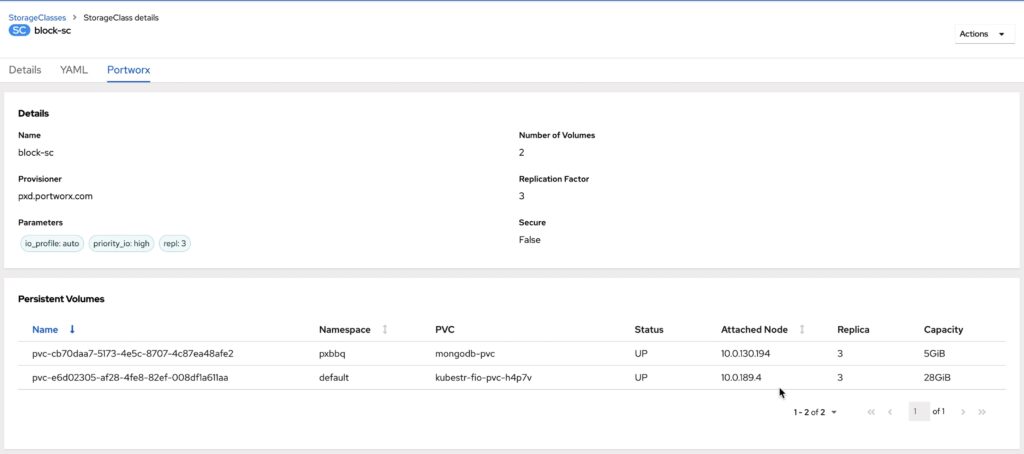
Figure 7: Portworx StorageClass Tab
Using the Portworx storage cluster tab, administrators can get details about the custom parameters set for each storage class, the number of persistent volumes dynamically provisioned using the storage class, and a table that lists all the persistent volumes deployed using that storage class. The OpenShift dynamic plugin eliminates the need for administrators to use multiple “kubectl get” and “kubectl describe” commands to find all these details—instead, they can just use a simple UI to monitor their storage classes.
Portworx provides native high availability and replication for the persistent volumes deployed on OpenShift clusters—which means that each volume can have multiple replicas running on different OpenShift worker nodes. Instead of using multiple CLI commands to “inspect” the volume, administrators can now use this simple tab to get the following details about individual persistent volumes:
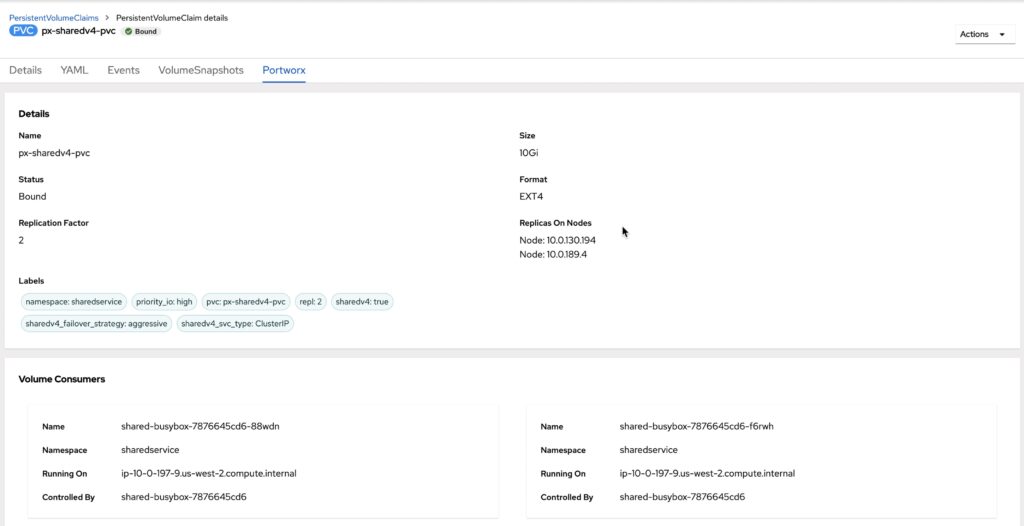
Figure 8: Portworx PVC Tab
Volume Details: Using this tab, administrators can get details like the PVC name, the bound status, the size and the filesystem format for the persistent volume, and all the custom parameters that the volumes inherit from the Portworx StorageClass.
Replication Factor and Topology: Portworx allows administrators to quickly identify how many replicas exist for each persistent volume and how they are distributed across their OpenShift cluster using the Portworx tab.
Volume Consumers: This tab also allows users to identify the pods that are using the volume to store/persist data. In the case of ReadWriteOnce volume, administrators can look at the individual pod that is storing data on that volume. But, in the case of ReadWriteMany volumes, administrators can get a quick list of all the different pods sharing the volume and see whether those pods are being managed by a Kubernetes object like a Deployment or StatefulSet.
In addition to all these tabs, the Portworx OpenShift Dynamic plugin is fully integrated with the OpenShift web console. So, if administrators have a preference for light mode vs dark mode for their web console, Portworx will honor those settings and deliver a seamless experience for the administrators.
Portworx introduced this OpenShift dynamic plugin as part of the Operator 23.5.0 release, which only works for internet-connected clusters (non air-gapped clusters) and clusters that do not have PX-Security enabled. However, we have an exciting roadmap ahead of us, which will not only add support for air-gapped clusters and PX-Security-enabled OpenShift clusters but will also add more widgets and features to further simplify the management of storage resources using the OpenShift web console.
If you want to look at a demonstration of the plugin in action, watch the following video. And if you want to try out the plugin, just install/upgrade the Portworx Operator version to 23.5.0 or higher on your OpenShift clusters.