


The IT landscape is undergoing a transition when it comes to application development. The majority of the new applications being built today are using cloud-native architectures and are packaged as containers and deployed using Kubernetes. To protect these microservices-based applications, you need a data protection solution that is built for the cloud-native world. PX-Backup from Portworx is built from the ground up for Kubernetes and delivers enterprise-grade application and data protection with recovery at the click of a button. PX-Backup allows you to protect your entire application, including application data and all the Kubernetes objects—such as Deployments, Services, ConfigMaps, etc.—that are part of your application.
In this blog, we will take a look at how you can monitor your PX-Backup-based data protection solution using Prometheus and Grafana. Combined, these tools provide an excellent open source solution for implementing observability for your Kubernetes clusters and the applications that are running on top. You can use the same tools for monitoring your PX-Backup environment. As part of our documentation, we provide you with a step-by-step guide to install and configure Prometheus and Grafana on your Kubernetes cluster for monitoring PX-Backup.
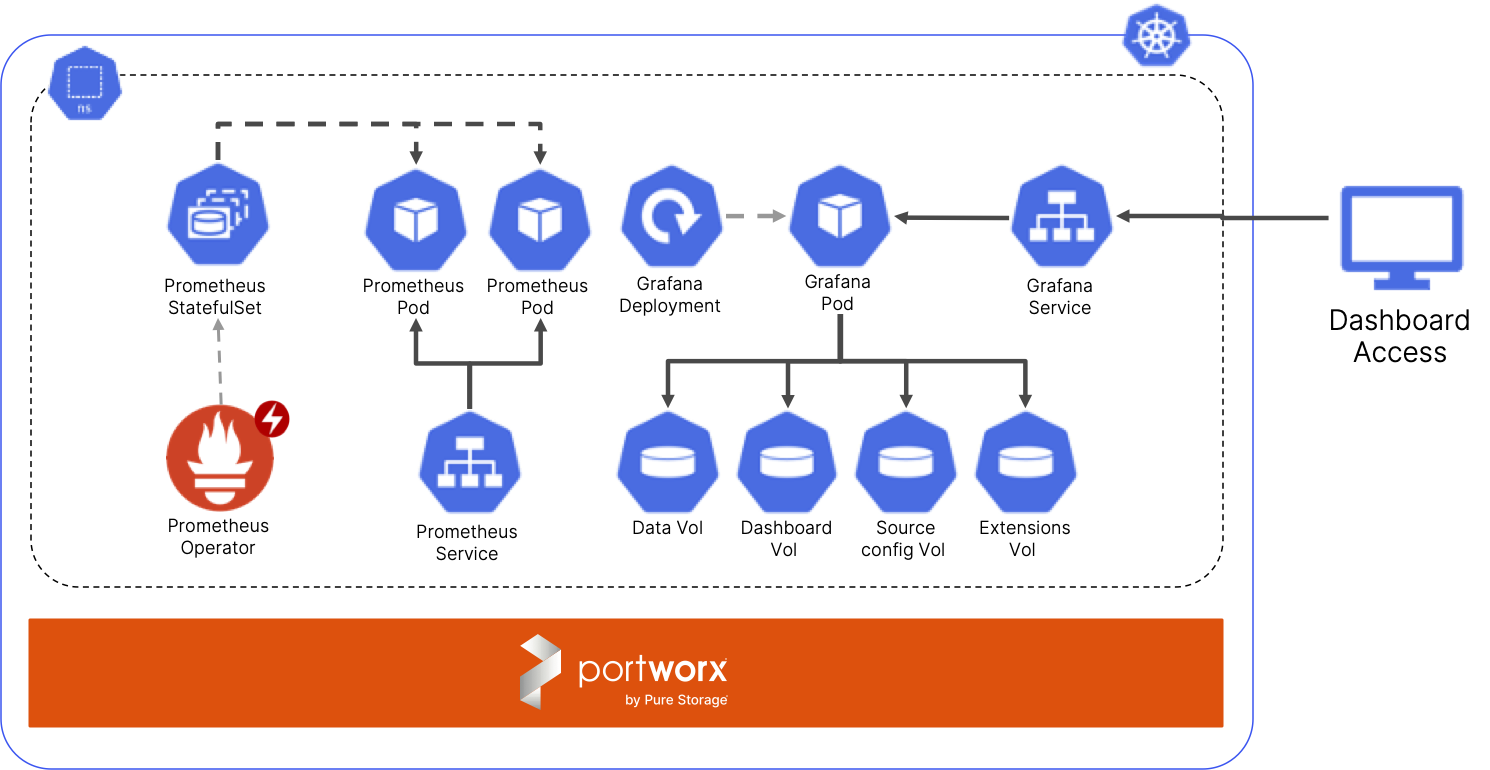
Once you have followed the installation steps, you should have all the Kubernetes objects shown below.
Once you are able to access the Grafana UI, add a Prometheus data source named px-backup, and import the PX-Backup Dashboard using the JSON file from the documentation.
At this point, you should be able to access the PX-Backup Grafana Dashboard and monitor your backup locations, jobs, and schedules.
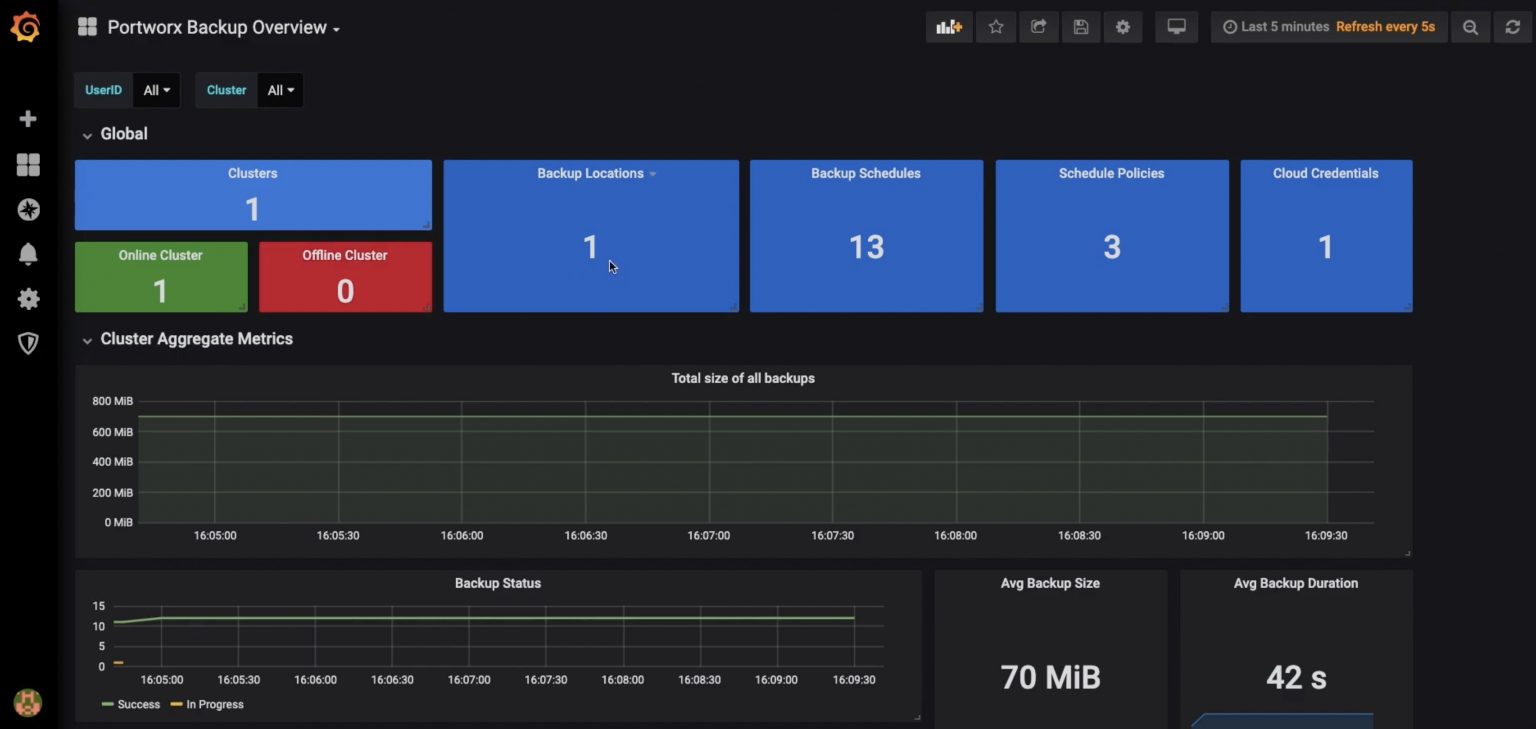
The PX-Backup dashboard ships with some default panels that are useful for day-to-day monitoring of your backup jobs. It helps you monitor all the applications running across different clusters that are being protected by a single instance of PX-Backup. As a developer or an operator, you can leverage this dashboard to monitor the following things:
All of this data can be refreshed every five seconds, and you can also get access to historical data by configuring the time range. You can go as far back as five years—if you need to—for compliance reasons.
In addition to all of the default panels, you can also choose to add custom panels or create new dashboards using metrics that the PX-Backup data source provides. Additional metrics include things like Backup Resource Count, Backup Volume Count, and more.
I hope this blog was helpful in explaining how you can extend your existing observability and monitoring tools to keep an eye on your backup and restore jobs configured using PX-Backup. If you prefer to watch a video walkthrough of the things we discussed in this blog, watch below: