


This post is part of our ongoing series on running Elasticsearch (ELK) for Kubernetes. We’ve published a number of articles about running Elasticsearch on Kubernetes for specific platforms and for specific use cases. If you are looking for a specific Kubernetes platform, check out these related articles.
Running HA ELK on Azure Kubernetes Service (AKS)
Running HA ELK on Google Kubernetes Engine (GKE)
Running HA ELK on Red Hat OpenShift
Running HA ELK on IBM Cloud Kubernetes Service (IKS)
Running HA ELK with Rancher Kubernetes Engine (RKE)
Running HA ELK on IBM Cloud Private
And now, onto the post…
Amazon EKS is a fully managed Kubernetes environment running in AWS. With Amazon EKS customers get a highly-available, secure Kubernetes control plane without needing to worry about provisioning, upgrades, or patching. Amazon EKS is certified by the Cloud Native Computing Foundation (CNCF) as Kubernetes conformant, which means it supports all existing plugins and tooling from the Kubernetes community, including Portworx.
Portworx, an EKS launch partner, is a cloud native storage platform to run persistent workloads deployed on a variety of orchestration engines including Kubernetes. With Portworx, customers can manage the database of their choice on any infrastructure using any container scheduler. It provides a single data management layer for all stateful services, no matter where they run.
This tutorial is a walk-through of the steps involved in deploying and managing a highly available Elasticsearch Kubernetes StatefulSet and Kibana deployment (Elasticseach/Logstash/ Kibana) on Amazon EKS.
In summary, to run HA ELK stack on Amazon EKS you need to:
Portworx is fully supported on Amazon EKS. Please follow the instructions to configure an Amazon EKS cluster.
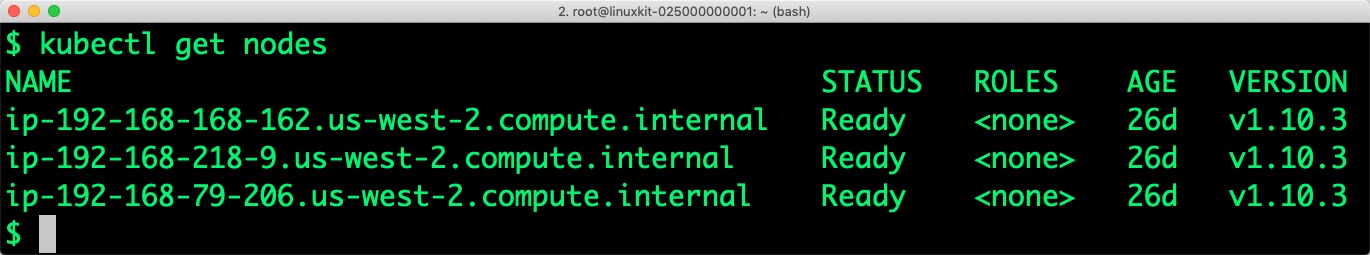
You should have a three node Kubernetes cluster deployed based on the default EKS configuration.
$ kubectl get nodes
NAME                                            STATUS   ROLES    AGE   VERSION
ip-192-168-168-162.us-west-2.compute.internal   Ready    <none>   26d   v1.10.3
ip-192-168-218-9.us-west-2.compute.internal     Ready    <none>   26d   v1.10.3
ip-192-168-79-206.us-west-2.compute.internal    Ready    <none>   26d   v1.10.3
Installing Portworx on Amazon EKS is not very different from installing it on a Kubernetes cluster setup through Kops. Portworx EKS documentation has the steps involved in running the Portworx cluster in a Kubernetes environment deployed in AWS.
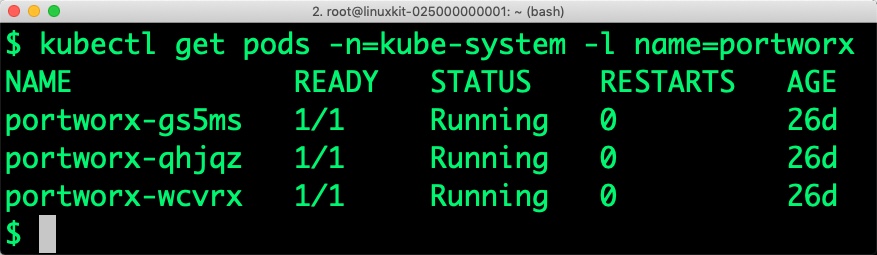
Portworx cluster needs to be up and running on EKS before proceeding to the next step. The kube-system namespace should have the Portworx pods in Running state.
$ kubectl get pods -n=kube-system -l name=portworx
NAME             READY     STATUS    RESTARTS   AGE
portworx-rckrx   1/1       Running   0          20m
portworx-vbp7g   1/1       Running   0          20m
portworx-wllbd   1/1       Running   0          20m
Once the EKS cluster is up and running, and Portworx is installed and configured, we will deploy a highly available ELK stack in Kubernetes.
Through storage class objects, an admin can define different classes of Portworx volumes that are offered in a cluster. These classes will be used during the dynamic provisioning of volumes. The storage class defines the replication factor, I/O profile (e.g., for a database or a CMS), and priority (e.g., SSD or HDD). These parameters impact the availability and throughput of workloads and can be specified for each volume. This is important because a production database will have different requirements than a development Jenkins cluster.
$ cat > px-elk-sc.yaml << EOF
kind: StorageClass
apiVersion: storage.k8s.io/v1beta1
metadata:
    name: px-ha-sc
provisioner: kubernetes.io/portworx-volume
parameters:
   repl: "3"
EOF
Create the storage class and verify it’s available in the default namespace.
$ kubectl create -f px-elk-sc.yaml
storageclass.storage.k8s.io/px-ha-sc created

$ kubectl get sc
NAME                PROVISIONER                     AGE
px-ha-sc     kubernetes.io/portworx-volume   24s
stork-snapshot-sc   stork-snapshot                 26d
Finally, let’s create an Elasticsearch cluster as a Kubernetes StatefulSet object. Like a Kubernetes deployment, a StatefulSet manages pods that are based on an identical container spec. Unlike a deployment, a StatefulSet maintains a sticky identity for each of their Pods. For more details on StatefulSets, refer to Kubernetes documentation.
A StatefulSet in Kubernetes requires a headless service to provide network identity to the pods it creates. The following command and the spec will help you create a headless service for your Elasticsearch installation.
$ cat > px-elastic-svc.yaml << EOF
kind: Service
apiVersion: v1
metadata:
  name: elasticsearch
  labels:
    app: elasticsearch
spec:
  selector:
    app: elasticsearch
  clusterIP: None
  ports:
    - port: 9200
      name: rest
    - port: 9300
      name: inter-node
EOF
$ kubectl create -f px-elastic-svc.yaml
service/elasticsearch created
Now, let’s go ahead and create a StatefulSet running Elasticsearch cluster based on the below spec.
cat > px-elastic-app.yaml << EOF
apiVersion: apps/v1
kind: StatefulSet
metadata:
  name: es-cluster
spec:
  serviceName: elasticsearch
  replicas: 3
  selector:
    matchLabels:
      app: elasticsearch
  template:
    metadata:
      labels:
        app: elasticsearch
    spec:
      containers:
      - name: elasticsearch
        image: docker.elastic.co/elasticsearch/elasticsearch-oss:6.4.3
        resources:
            limits:
              cpu: 1000m
            requests:
              cpu: 100m
        ports:
        - containerPort: 9200
          name: rest
          protocol: TCP
        - containerPort: 9300
          name: inter-node
          protocol: TCP
        volumeMounts:
        - name: data
          mountPath: /usr/share/elasticsearch/data
        env:
          - name: cluster.name
            value: px-elk-demo
          - name: node.name
            valueFrom:
              fieldRef:
                fieldPath: metadata.name
          - name: discovery.zen.ping.unicast.hosts
            value: "es-cluster-0.elasticsearch,es-cluster-1.elasticsearch,es-cluster-2.elasticsearch"
          - name: discovery.zen.minimum_master_nodes
            value: "2"
          - name: ES_JAVA_OPTS
            value: "-Xms512m -Xmx512m"
      initContainers:
      - name: fix-permissions
        image: busybox
        command: ["sh", "-c", "chown -R 1000:1000 /usr/share/elasticsearch/data"]
        securityContext:
          privileged: true
        volumeMounts:
        - name: data
          mountPath: /usr/share/elasticsearch/data
      - name: increase-vm-max-map
        image: busybox
        command: ["sysctl", "-w", "vm.max_map_count=262144"]
        securityContext:
          privileged: true
      - name: increase-fd-ulimit
        image: busybox
        command: ["sh", "-c", "ulimit -n 65536"]
        securityContext:
          privileged: true
  volumeClaimTemplates:
  - metadata:
      name: data
      labels:
        app: elasticsearch
    spec:
      accessModes: [ "ReadWriteOnce" ]
      storageClassName: px-ha-sc
      resources:
        requests:
          storage: 10Gi
EOF
$ kubectl apply -f px-elastic-app.yaml
statefulset.apps/es-cluster created
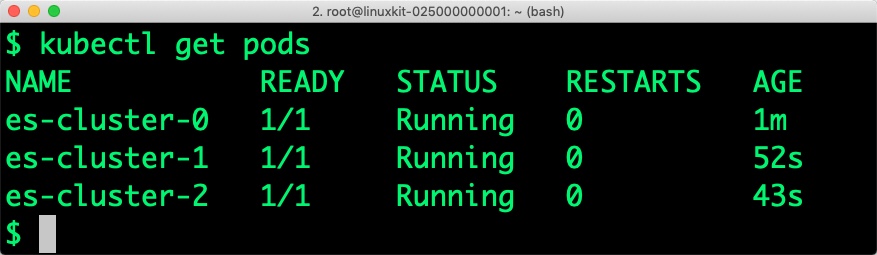
Verify that all the pods are in the Running state before proceeding further.
$ kubectl get statefulset
NAME        DESIRED   CURRENT   AGE
es-cluster   3         3         36s
Let’s also check if persistent volume claims are bound to the volumes.
$ kubectl get pvc
NAME                         STATUS    VOLUME                                     CAPACITY   ACCESS MODES   STORAGECLASS      AGE
data-es-cluster-0   Bound    pvc-475b9575-fc35-11e8-94dd-069e146e671c   10Gi       RWO
           px-ha-sc       2m
data-es-cluster-1   Bound    pvc-5e60efba-fc35-11e8-94dd-069e146e671c   10Gi       RWO
           px-ha-sc       1m
data-es-cluster-2   Bound    pvc-75adad67-fc35-11e8-94dd-069e146e671c   10Gi       RWO
           px-ha-sc       48s
Notice the naming convention followed by Kubernetes for the pods and volume claims. The arbitrary number attached to each object indicates the association of pods and volumes.
We can now inspect the Portworx volume associated with one of the Elasticsearch pods by accessing the pxctl tool.
$ VOL=`kubectl get pvc | grep es-cluster-0 | awk '{print $3}'`
$ kubectl exec -it $PX_POD -n kube-system -- /opt/pwx/bin/pxctl volume inspect ${VOL}
Volume	:  827179985464626518
	Name            	 :  pvc-475b9575-fc35-11e8-94dd-069e146e671c
	Size            	 :  10 GiB
	Format          	 :  xfs
	HA              	 :  3
	IO Priority     	 :  LOW
	Creation time   	 :  Dec 10 04:37:26 UTC 2018
	Shared          	 :  no
	Status          	 :  up
	State           	 :  Attached: ip-192-168-168-162.us-west-2.compute.internal (192.168.168.162)
	Device Path     	 :  /dev/pxd/pxd827179985464626518
	Labels          	 :  namespace=default,pvc=data-es-cluster-0
	Reads           	 :  91
	Reads MS        	 :  48
	Bytes Read      	 :  1282048
	Writes          	 :  32
	Writes MS       	 :  84
	Bytes Written   	 :  2379776
	IOs in progress 	 :  0
	Bytes used      	 :  10 MiB
	Replica sets on nodes:
		Set 0
		  Node 		 : 192.168.168.162 (Pool 0)
		  Node 		 : 192.168.79.206 (Pool 0)
		  Node 		 : 192.168.218.9 (Pool 0)
	Replication Status	 :  Up
	Volume consumers	 :
		- Name           : es-cluster-0 (475c2be2-fc35-11e8-94dd-069e146e671c) (Pod)
		  Namespace      : default
		  Running on     : ip-192-168-168-162.us-west-2.compute.internal
		  Controlled by  : es-cluster (StatefulSet)
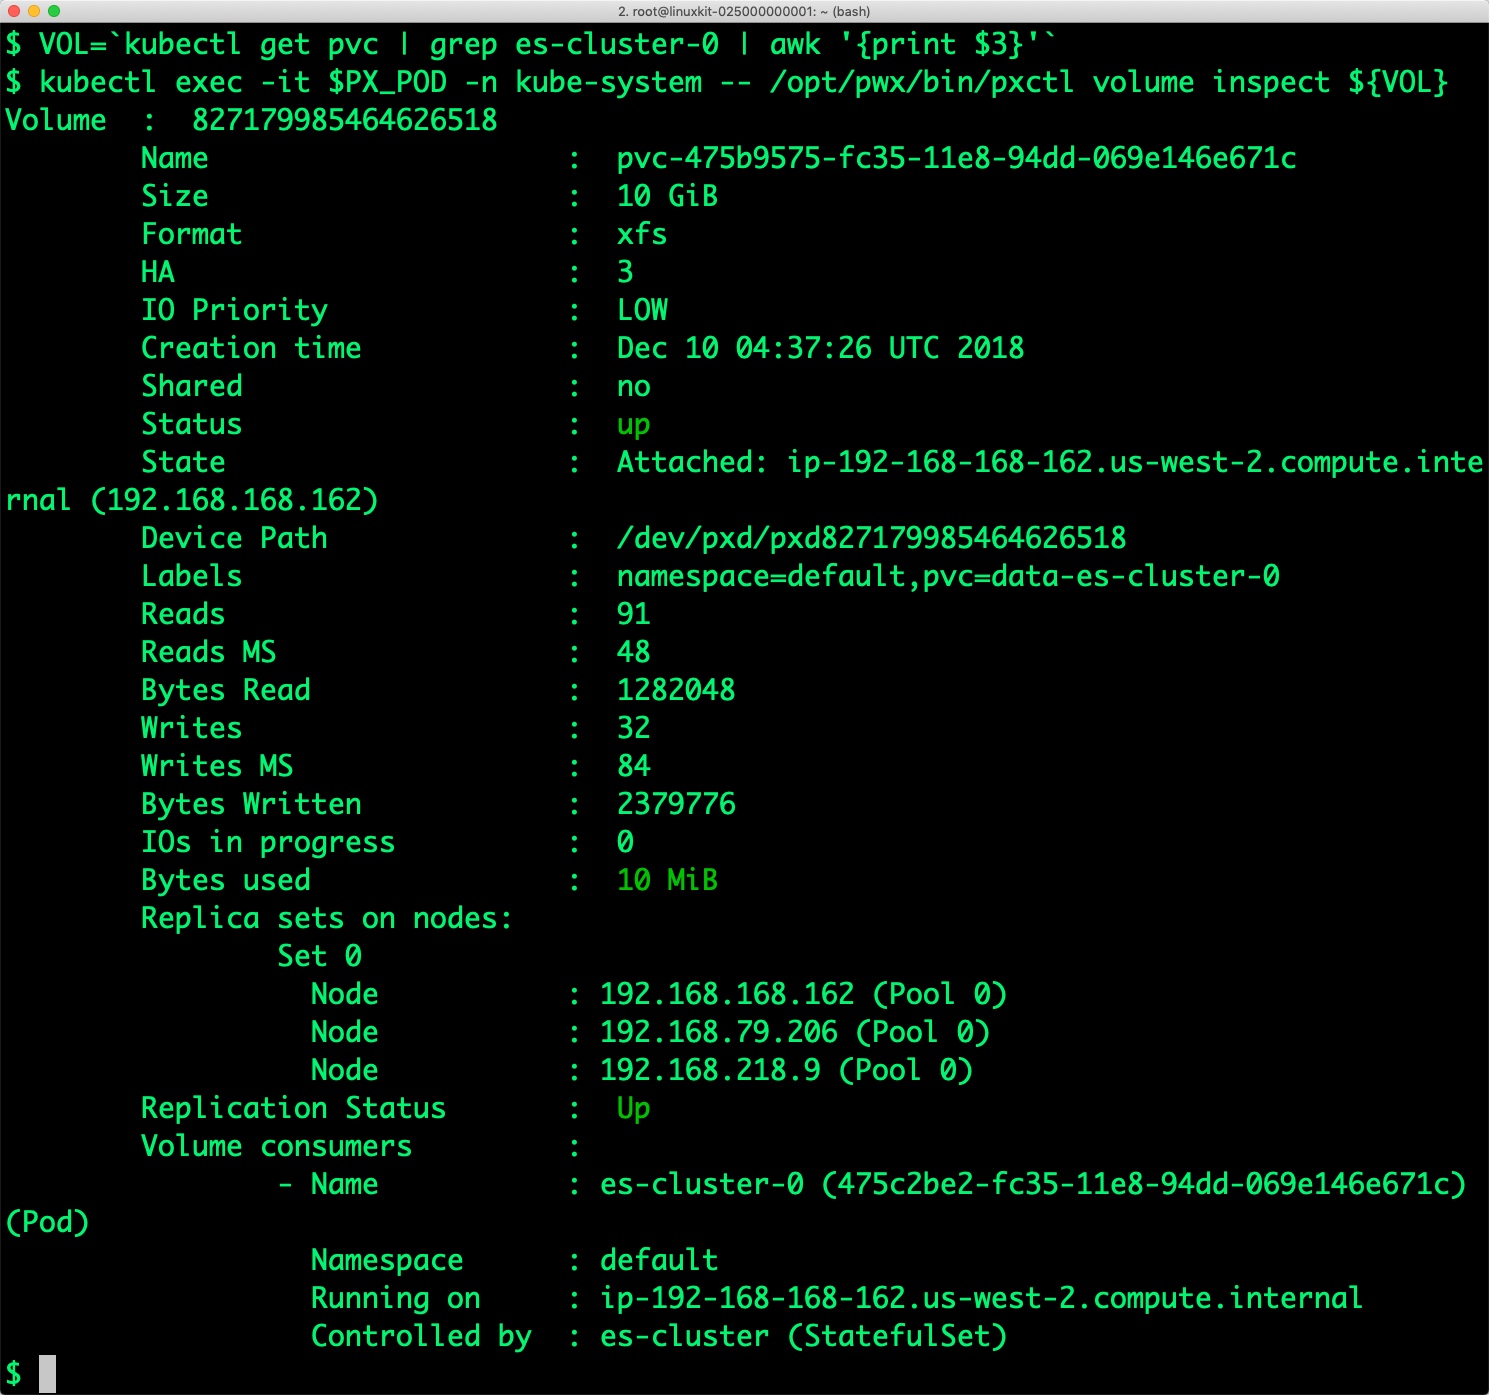
The output from the above command confirms the creation of volumes that are backing Elasticsearch nodes.
We can also use Elasticsearch’s REST endpoint to check the status of the cluster. Let’s configure port forwarding for the first node of the cluster.
$ kubectl port-forward es-cluster-0 9200:9200 &
[1] 19357
$ curl localhost:9200
{
  "name" : "es-cluster-0",
  "cluster_name" : "px-elk-demo",
  "cluster_uuid" : "UP8eA4XcS9aotWPTsqpMpA",
  "version" : {
    "number" : "6.4.3",
    "build_flavor" : "oss",
    "build_type" : "tar",
    "build_hash" : "fe40335",
    "build_date" : "2018-10-30T23:17:19.084789Z",
    "build_snapshot" : false,
    "lucene_version" : "7.4.0",
    "minimum_wire_compatibility_version" : "5.6.0",
    "minimum_index_compatibility_version" : "5.0.0"
  },
  "tagline" : "You Know, for Search"
}
Let’s get the count of the nodes.
$ curl -s localhost:9200/_nodes | jq ._nodes
{
  "total": 3,
  "successful": 3,
  "failed": 0
}
Kibana exposes a port for accessing the UI. Let’s start by creating the service first.
cat > px-kibana-svc.yaml << EOF
apiVersion: v1
kind: Service
metadata:
  name: kibana
  labels:
    app: kibana
spec:
  ports:
  - port: 5601
  selector:
    app: kibana
EOF
$ kubectl create -f px-kibana-svc.yaml
service/kibana created
Create the Kibana deployment with the following YAML file.
cat > px-kibana-app.yaml << EOF
apiVersion: apps/v1
kind: Deployment
metadata:
  name: kibana
  labels:
    app: kibana
spec:
  replicas: 1
  selector:
    matchLabels:
      app: kibana
  template:
    metadata:
      labels:
        app: kibana
    spec:
      containers:
      - name: kibana
        image: docker.elastic.co/kibana/kibana-oss:6.4.3
        resources:
          limits:
            cpu: 1000m
          requests:
            cpu: 100m
        env:
          - name: ELASTICSEARCH_URL
            value: http://elasticsearch:9200
        ports:
        - containerPort: 5601
EOF
$ kubectl create -f px-kibana-app.yaml
deployment.apps/kibana created
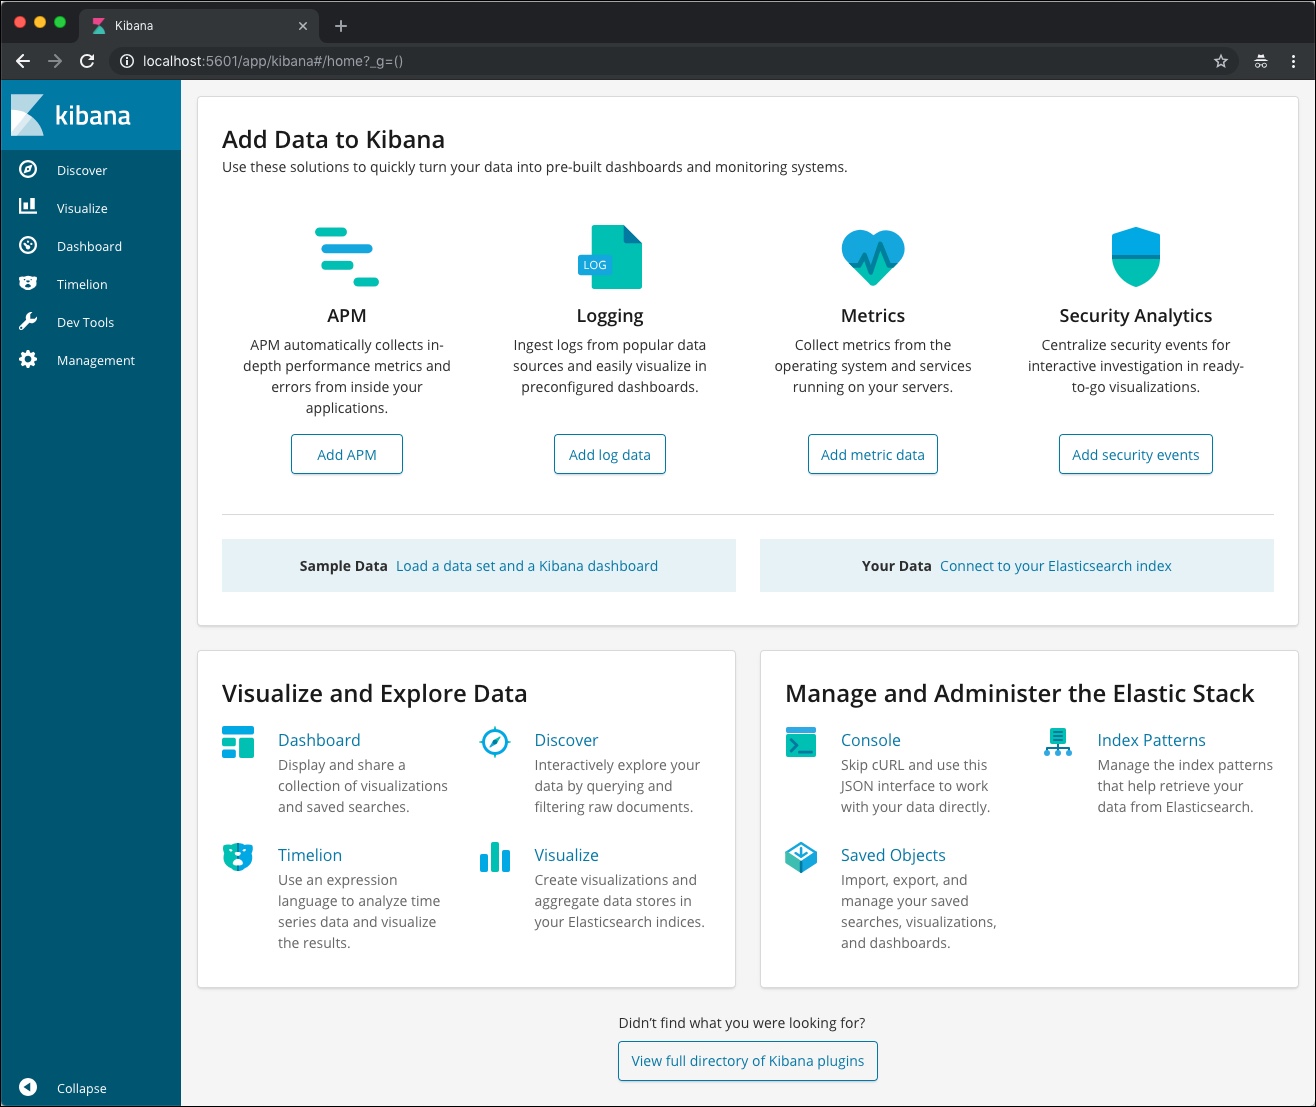
We can verify Kibana installation by accessing the UI from the browser. Before that, let’s expose the internal IP to our development machine. Once it is done, you can access the UI from http://localhost:5601.
$ KIBANA_POD=$(kubectl get pods -l app=kibana -o jsonpath='{.items[0].metadata.name}')
$ kubectl port-forward $KIBANA_POD 5601:5601 &
[1] 35701
Now, we are ready to ingest data into the Elasticsearch through Logstash. For this, we will use the Docker image of Logstash running in your development machine.
Let’s get some sample data from one of the Github repositories of Elasticsearch.
Create a directory and fetch the dataset into that. Uncompress the dataset with the gzip utility.
$ mkdir logstash && cd logstash
$ wget https://github.com/elastic/elk-index-size-tests/raw/master/logs.gz
--2018-12-10 10:34:06--  https://github.com/elastic/elk-index-size-tests/raw/master/logs.gz
Resolving github.com (github.com)... 192.30.253.113, 192.30.253.112
Connecting to github.com (github.com)|192.30.253.113|:443... connected.
HTTP request sent, awaiting response... 302 Found
Location: https://raw.githubusercontent.com/elastic/elk-index-size-tests/master/logs.gz [following]
--2018-12-10 10:34:08--  https://raw.githubusercontent.com/elastic/elk-index-size-tests/master/logs.gz
Resolving raw.githubusercontent.com (raw.githubusercontent.com)... 151.101.0.133, 151.101.64.133, 151.101.128.133, ...
Connecting to raw.githubusercontent.com (raw.githubusercontent.com)|151.101.0.133|:443... connected.
HTTP request sent, awaiting response... 200 OK
Length: 6632680 (6.3M) [application/octet-stream]
Saving to: 'logs.gz'

logs.gz                               100%[=======================================================================>]   6.33M  9.13MB/s    in 0.7s

2018-12-10 10:34:09 (9.13 MB/s) - 'logs.gz' saved [6632680/6632680]
$ gzip -d logs.gz
Logstash needs a configuration file that points the agent to the source log file and the target Elasticsearch cluster.
Create the below configuration file in the same directory.
$ cat > logstash.conf < "/data/logs"
		type => "logs"
		start_position => "beginning"
	}

}

filter
{
	grok{
		match => {
			"message" => "%{COMBINEDAPACHELOG}"
		}
	}
	mutate{
		convert => { "bytes" => "integer" }
	}
	date {
		match => [ "timestamp", "dd/MMM/YYYY:HH:mm:ss Z" ]
		locale => en
		remove_field => "timestamp"
	}
	geoip {
		source => "clientip"
	}
	useragent {
		source => "agent"
		target => "useragent"
	}
}


output
{
	stdout {
		codec => dots
	}

 	elasticsearch {
		hosts => [ "docker.for.mac.localhost:9200" ]
 	}

}
EOF
Notice how Logstash talks to Elasticsearch within the Docker container. The alias docker.for.mac.localhost maps to the host port on which the Docker VM is running. If you are running it on a Windows machine, use the string docker.for.win.localhost.
With the sample log and configuration files in place, let’s launch the Docker container. We are passing an environment variable, running the container in host networking mode, and mounting the ./logstash directory as /data within the container.
Navigate back to the parent directory and launch the Logstash Docker container.
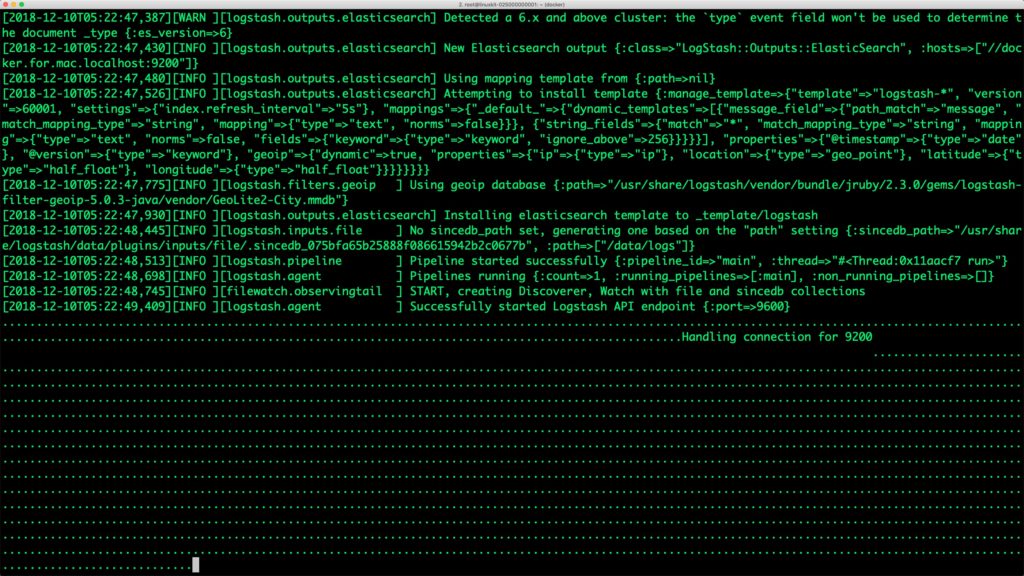
$ cd ..
$ docker run --rm -it --network host\
>	-e XPACK_MONITORING_ENABLED=FALSE \
>	-v $PWD/logstash:/data docker.elastic.co/logstash/logstash:6.5.1 \
>	/usr/share/logstash/bin/logstash -f /data/logstash.conf
After a few seconds, the agent starts streaming the log file to Elasticsearch cluster.
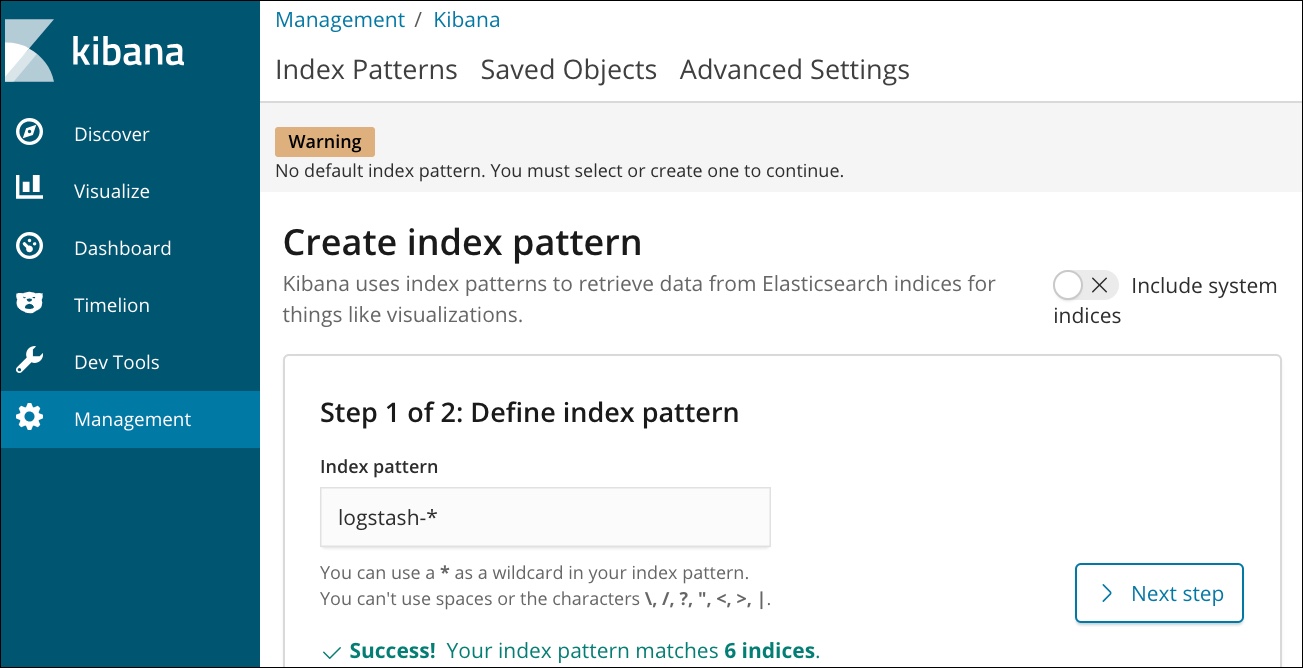
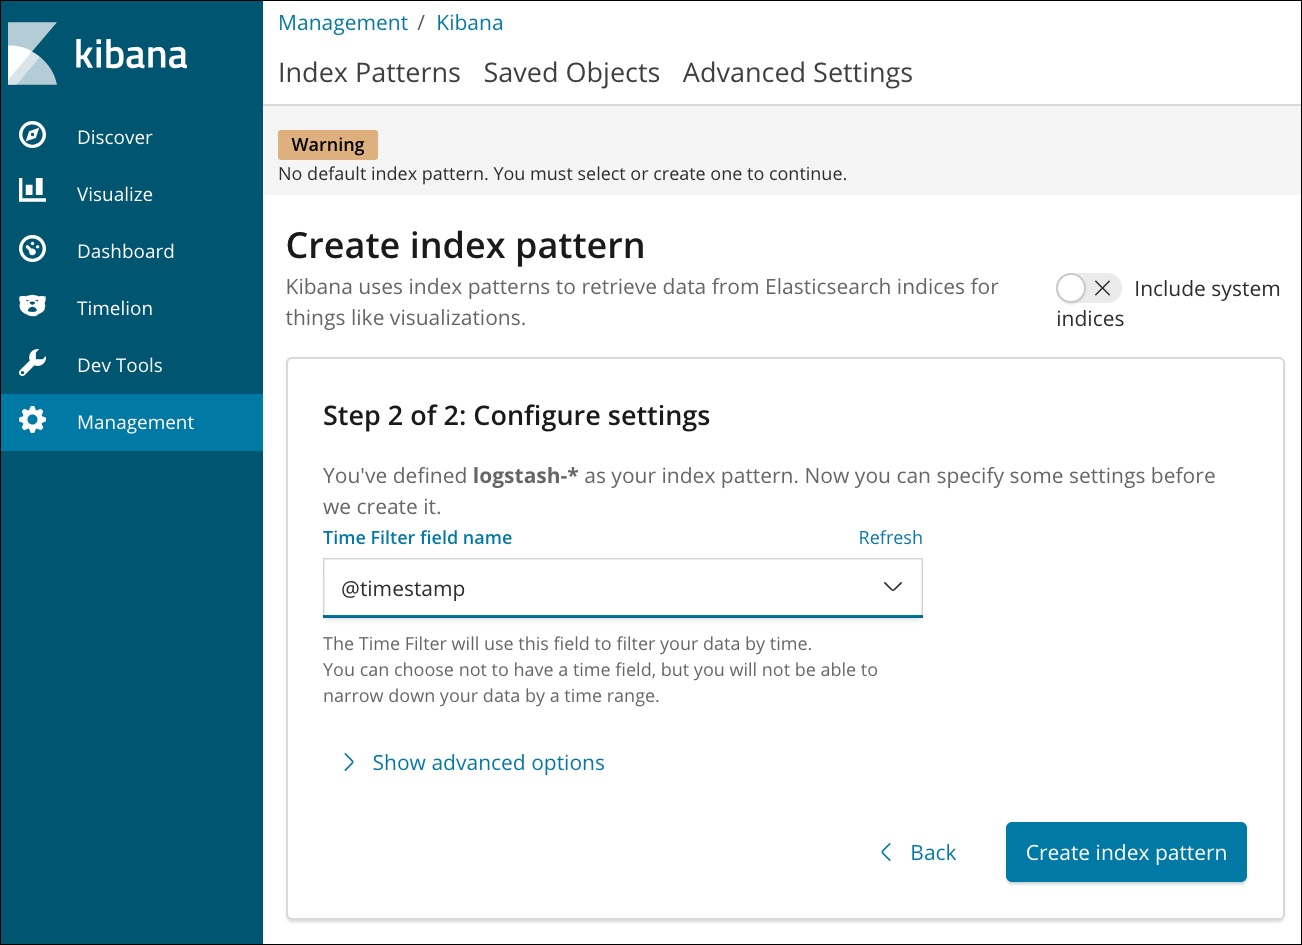
Switch to the browser to access the Kibana dashboard. Click the index pattern for Logstash by clicking on the Management tab and choosing @timestamp as the time filter field.
Click on the Discover tab, choose the timepicker and select Last 5 Years as the range. You should see Apache logs in the dashboard.
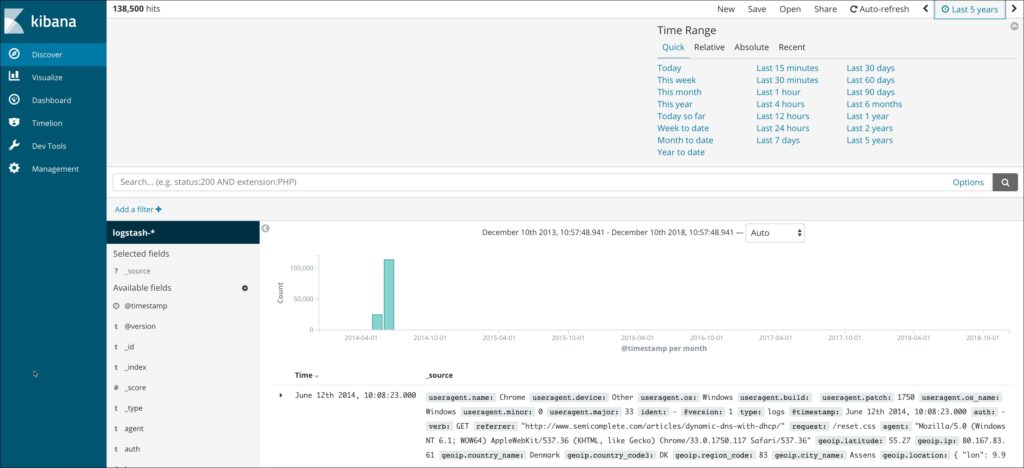
In a few minutes, the Logstash agent running in the Docker container will ingest all the data.
When one of the nodes running en Elasticsearch pod goes down, the pod will automatically get scheduled in another node with the same PVC backing it.
We will simulate the failover by cordoning off one of the nodes and deleting the Elasticsearch pod deployed on it. When the new pod is created it has the same number of documents as the original pod.
First, let’s get the count of the documents indexed and stored on node es-cluster-0. We can access this by calling the HTTP endpoint of the node.
$ EL_NODE_NAME=`curl -s 'http://localhost:9200/_nodes/es-cluster-0/stats/indices?pretty=true' | jq -r '.nodes | keys[0]'`

$ curl -s 'http://localhost:9200/_nodes/es-cluster-0/stats/indices?pretty=true' | jq .nodes.${EL_NODE_NAME}.indices.docs.count
140770
Let’s get the node name where the first Elasticsearch pod is running.
$ NODE=`kubectl get pods es-cluster-0 -o json | jq -r .spec.nodeName`
Now, let’s simulate the node failure by cordoning off the Kubernetes node.
$ kubectl cordon ${NODE}
node/ip-192-168-168-162.us-west-2.compute.internal cordoned
The above command disabled scheduling on one of the nodes.
$ kubectl get nodes
NAME                                            STATUS                     ROLES    AGE   VERSION
ip-192-168-168-162.us-west-2.compute.internal   Ready,SchedulingDisabled      26d   v1.10.3
ip-192-168-218-9.us-west-2.compute.internal     Ready                         26d   v1.10.3
ip-192-168-79-206.us-west-2.compute.internal    Ready                         26d   v1.10.3
Let’s go ahead and delete the pod es-cluster-0 running on the node that is cordoned off.
$ kubectl delete pod es-cluster-0
pod "es-cluster-0" deleted
Kubernetes controller now tries to create the pod on a different node.
$ kubectl get pods
NAME          READY     STATUS              RESTARTS   AGE
es-cluster-0            0/1     Init:2/3   0          7s
es-cluster-1            1/1     Running    0          1h
es-cluster-2            1/1     Running    0          1h
kibana-7844d64b-rlnr6   1/1     Running    0          1h
Wait for the pod to be in Running state on the node.
$ kubectl get pods
NAME          READY     STATUS              RESTARTS   AGE
es-cluster-0  1/1       Running              0          1m
es-cluster-1   1/1       Running             0          1h
es-cluster-2   1/1       Running             0          1h
Finally, let’s verify that the data is still available.
$ EL_NODE_NAME=`curl -s 'http://localhost:9200/_nodes/es-cluster-0/stats/indices?pretty=true' | jq -r '.nodes | keys[0]'`

$ curl -s 'http://localhost:9200/_nodes/es-cluster-0/stats/indices?pretty=true' | jq .nodes.${EL_NODE_NAME}.indices.docs.count
140770
The matching document count confirms that the pod is backed by the same PV.
Portworx enables storage admins to perform backup and restore operations through the snapshots. 3DSnap is a feature to capture consistent snapshots from multiple nodes of a database cluster. This is highly recommended when running a multi-node Elasticsearch cluster as a Kubernetes StatefulSet. The 3DSnap will create a snapshot from each of the nodes in the cluster, which ensures that the state is accurately captured from the distributed cluster.
3DSnap allows administrators to execute commands just before taking the snapshot and right after completing the task of taking a snapshot. These triggers will ensure that the data is fully committed to the disk before the snapshot. Similarly, it is possible to run a workload-specific command to refresh or force sync immediately after restoring the snapshot.
This section will walk you through the steps involved in creating and restoring a 3DSnap for the Elasticsearch statefulset.
It’s a good idea to flush the data to the disk before initiating the snapshot creation. This is defined through a rule, which is a Custom Resource Definition created by Stork, a Kubernetes scheduler extender and Operator created by Portworx.
$ cat > px-elastic-rule.yaml << EOF
apiVersion: stork.libopenstorage.org/v1alpha1
kind: Rule
metadata:
  name: px-elastic-rule
spec:
  - podSelector:
      app: elasticsearch
    actions:
    - type: command
      value: curl -s 'http://localhost:9200/_all/_flush'
EOF
Create the rule from the above YAML file.
$ kubectl create -f px-elastic-rule.yaml
rule.stork.libopenstorage.org "px-elastic-rule" created
We will now initiate a 3DSnap task to backup all the PVCs associated with the Elasticsearch pods belonging to the StatefulSet.
$ cat > px-elastic-snap.yaml << EOF
apiVersion: volumesnapshot.external-storage.k8s.io/v1
kind: VolumeSnapshot
metadata:
  name: elastic-3d-snapshot
  annotations:
    portworx.selector/app: elasticsearch
    stork.rule/pre-snapshot: px-elastic-rule
spec:
  persistentVolumeClaimName: data-es-cluster-0
EOF
$ kubectl create -f px-elastic-snap.yaml
volumesnapshot.volumesnapshot.external-storage.k8s.io "elastic-3d-snapshot" created
Let’s now verify that the snapshot creation is successful.
$ kubectl get volumesnapshot
NAME                                                                         AGE
elastic-3d-snapshot                                                          21s
elastic-3d-snapshot-data-es-cluster-0-1e664b65-2189-11e9-865e-de77e24fecce   11s
elastic-3d-snapshot-data-es-cluster-1-1e664b65-2189-11e9-865e-de77e24fecce   12s
elastic-3d-snapshot-data-es-cluster-2-1e664b65-2189-11e9-865e-de77e24fecce   11s
$ kubectl get volumesnapshotdatas
NAME                                                                         AGE
elastic-3d-snapshot-data-es-cluster-0-1e664b65-2189-11e9-865e-de77e24fecce   35s
elastic-3d-snapshot-data-es-cluster-1-1e664b65-2189-11e9-865e-de77e24fecce   36s
elastic-3d-snapshot-data-es-cluster-2-1e664b65-2189-11e9-865e-de77e24fecce   35s
k8s-volume-snapshot-24636a1c-2189-11e9-b33a-4a3867a50193                     35s
Let’s now restore from the 3DSnap. Before that, we will simulate the crash by deleting the StatefulSet and associated PVCs.
$ kubectl delete sts es-cluster
statefulset.apps "es-cluster" deleted
$ kubectl delete pvc -l app=elasticsearch
persistentvolumeclaim "data-es-cluster-0" deleted
persistentvolumeclaim "data-es-cluster-1" deleted
persistentvolumeclaim "data-es-cluster-2" deleted
Now our Kubernetes cluster has no Elasticsearch instance running. Let’s go ahead and restore the data from the snapshot before relaunching the StatefulSet.
We will now create three Persistent Volume Claims (PVCs) from existing 3DSnap with exactly the same volume name that the StatefulSet expects. When the pods are created as a part of the StatefulSet, they point to the existing PVCs which are already populated with the data restored from the snapshots.
Let’s create three PVCs from the 3DSnap snapshots. Notice how the annotation points to the snapshot in each PVC manifest.
$ cat > px-elastic-pvc-0.yaml << EOF
apiVersion: v1
kind: PersistentVolumeClaim
metadata:
  name: data-es-cluster-0
  labels:
     app: elasticsearch
  annotations:
    snapshot.alpha.kubernetes.io/snapshot: "elastic-3d-snapshot-data-es-cluster-0-1e664b65-2189-11e9-865e-de77e24fecce"
spec:
  accessModes:
     - ReadWriteOnce
  storageClassName: stork-snapshot-sc
  resources:
    requests:
      storage: 5Gi
EOF
$ cat > px-elastic-pvc-1.yaml << EOF
apiVersion: v1
kind: PersistentVolumeClaim
metadata:
  name: data-es-cluster-1
  labels:
     app: elasticsearch
  annotations:
    snapshot.alpha.kubernetes.io/snapshot: "elastic-3d-snapshot-data-es-cluster-1-1e664b65-2189-11e9-865e-de77e24fecce"
spec:
  accessModes:
     - ReadWriteOnce
  storageClassName: stork-snapshot-sc
  resources:
    requests:
      storage: 5Gi
EOF
$ cat > px-elastic-pvc-2.yaml << EOF
apiVersion: v1
kind: PersistentVolumeClaim
metadata:
  name: data-es-cluster-2
  labels:
     app: elasticsearch
  annotations:
    snapshot.alpha.kubernetes.io/snapshot: "elastic-3d-snapshot-data-es-cluster-2-1e664b65-2189-11e9-865e-de77e24fecce"
spec:
  accessModes:
     - ReadWriteOnce
  storageClassName: stork-snapshot-sc
  resources:
    requests:
      storage: 5Gi
EOF
Create the PVCs from the above definitions.
$ kubectl create -f px-elastic-snap-pvc-0.yaml
persistentvolumeclaim "data-es-cluster-0" created

$ kubectl create -f px-elastic-snap-pvc-1.yaml
persistentvolumeclaim "data-es-cluster-1" created

$ kubectl create -f px-elastic-snap-pvc-2.yaml
persistentvolumeclaim "data-es-cluster-2" created
Verify that the new PVCs are ready and bound.
$ kubectl get pvc
NAME                         STATUS    VOLUME                                     CAPACITY   ACCESS MODES   STORAGECLASS        AGE
data-es-cluster-0   Bound     pvc-31389fa1-218a-11e9-865e-de77e24fecce   5Gi        RWO            stork-snapshot-sc   12s
data-es-cluster-1   Bound     pvc-3319c230-218a-11e9-865e-de77e24fecce   5Gi        RWO            stork-snapshot-sc   9s
data-es-cluster-2   Bound     pvc-351bb0b6-218a-11e9-865e-de77e24fecce   5Gi        RWO            stork-snapshot-sc   5s
With the PVCs in place, we are ready to launch the StatefulSet with no changes to the YAML file. Everything remains exactly the same while the data is already restored from the snapshots.
$ kubectl create -f px-elastic-app.yaml
statefulset.apps "es-cluster" created
Check the data through the curl request sent to one the Elastic pods.
$ kubectl port-forward es-cluster-0 9200:9200 &
$ EL_NODE_NAME=`curl -s 'http://localhost:9200/_nodes/es-cluster-0/stats/indices?pretty=true'| jq -r '.nodes | keys[0]'`
$ curl -s 'http://localhost:9200/_nodes/es-cluster-0/stats/indices?pretty=true' | jq .nodes.${EL_NODE_NAME}.indices.docs.count
140770
Congratulations! You have successfully restored an application consistent snapshot for Elasticsearch.
Portworx can easily be deployed on Amazon EKS to run stateful workloads in production. It integrates well with K8s StatefulSets by providing dynamic provisioning. Additional operations such as expanding the volumes and performing backups stored as snapshots on object storage can be performed while managing production workloads.