Once Upon a Time
When I was interviewing with Portworx, I may have mentioned that I knew Cassandra. Little did I know what I’d be signing up for!
Fast forward a few weeks after joining, and I was asked to test Cassandra on our product. Portworx (“PX”) provides an abstracted persistent storage fabric and data services for containers. We know there are many Cassandra deployments using containers, and my challenge was to list the benefits that Portworx provides Cassandra users, who already have to grapple with:
- Learning curves to scale (each time one goes to a Cassandra Summit they come back with spaghetti mess of new information that they’re trying to put to use),
- Repairs replete with risks of getting stuck to worry about (sensitive topic and I won’t press too much here),
- Node failures, decommissions, replacements to do on the fly (to be fair, Cassandra makes this part fairly simple but then when has anyone confidently pressed the red button on hot swaps, replacements, re-wirings?),
- Making sure their schedulers are doing their things (oh great! Yet another thing to worry about),
- Standing in the corner and letting out silent tears when random, passing developers point at them and say “latencies of queries are too high!” (What? So you’re telling me that rebooting the node and doing a ritual dance didn’t work?)
In our first meeting, our co-founder Gou welcomed me and slipped in a quick “Hey man! You seem to know Cassandra! We want to tell our customers to reduce their Cassandra replication to 1 and increase ours instead. What do you think?” Imagine that! Was our CTO nuts? And you thought your job was tough! With thoughts of having to go back home and work on my resume, I only managed, “Not quite a good idea but let me understand our product first.”
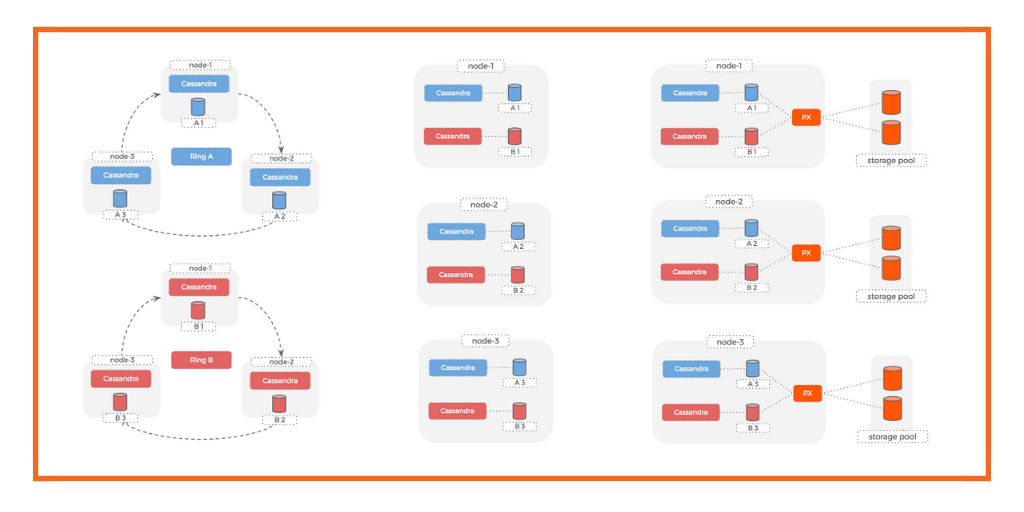
With some understanding of our product, I started a series of tests which included some configurations that we were to recommend to our customers. At a high level these test scenarios were given to me (to run with containerized Cassandra):
- Storage on the host.
- Storage using PX abstracted volumes (Cassandra replication the usual (say 3) and PX replication = 1).
- Storage using PX abstracted volumes (Cassandra replication = 1 and PX replication = 3).
Somehow I wasn’t comfortable with #3, not only because it seemed to go against the grain of accepted practices (for the sake of adherence) but also because queries could time out, query quora may not be met, data may be lost. etc.
But as I became familiar with the PX product, I got a few of my own ideas to try. For example, why not use our replication feature to provide a cross datacenter/availability zone availability? That way if there is a catastrophic failure in one you can spin up a brand new datacenter and use the data in the store-level replica.
So what should we expect from running the above tests? When we threw in PX, we expected some overhead. For example, every time Cassandra flushes to disk, or every time a read misses Cassandra caches and hits the disk, then it would go to the local disk. Now with the PX volumes in place, PX will have to do its own bookkeeping to acknowledge writes and reads. For example, if PX replication is on then PX also needs to ensure quorum. How large would the overhead be?
So here is how I planned it out:
- Storage on the host.
- Storage using PX repl = 1 (Cassandra = 3).
Expecting a deterioration in performance because we may have added an overhead, but not wanting to turn down Cassandra replication yet, I thought “what if we mitigate the delays by having the commitlogs mapped onto a faster volume (volume mounted on a NVMe/SSD) and the data mapped onto the regular HDD?” Writes go to memory first and then to the commitlog. Success with both operations is necessary to acknowledge the write to the application. However when you write commitlogs to HDD your “long pole” now becomes the commitlogs. Fortunately Portworx has a Class of Service feature that lets you create and mount volumes on disks that give you the desired throughput. - Try PX replication = 3 and Cassandra = 1 and see if I can confirm my fears.
Expecting a sharp increase in query timeouts, I was wondering if we have a middle ground like PX replication = 2 and Cassandra replication = 2 (the main concern was that with Cassandra replication = 1 if the write doesn’t go through for whatever reason, then the data is not even in the cluster. Yes, Cassandra hints will help but you don’t want to run into a situation where when the node becomes available it is now swamped with the hints transfer, adding to the already high load on the cluster from the application.)
Fancy Diagrams
I use Cassandra-stress (Cassandra version 2.1.15.1). Why not Cassandra 3.x? Because I also wanted to try out YCSB and I didn’t find a YCSB version supporting that yet. For each run I wrote 10M writes initially and then 3 runs of a mixed load (approx 5M writes and 5M reads). The results generally agreed with my expectations. However, as I started plotting the numbers there were a few things that caught my attention and got me excited.
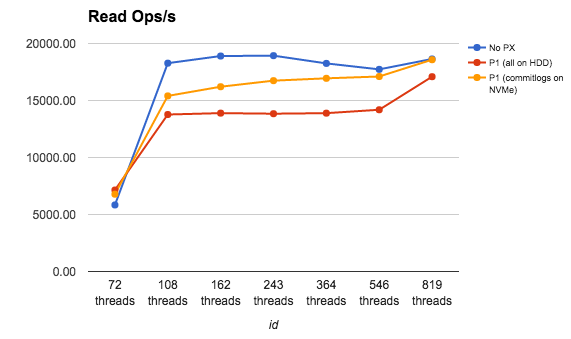
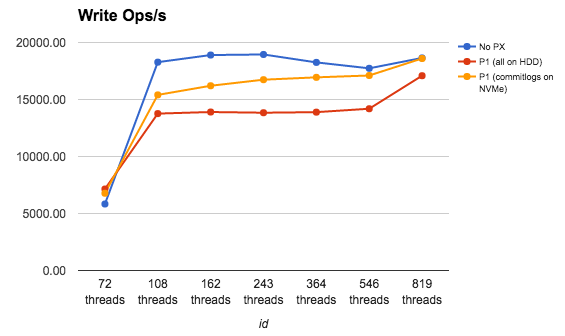 The two graphs above show that there seems to be some overhead. And the effect of that overhead is reduced by the strategic placement of data and commitlogs.
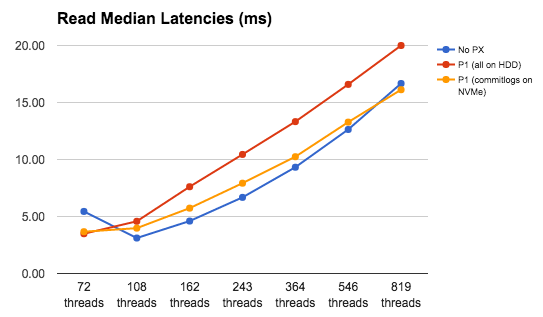
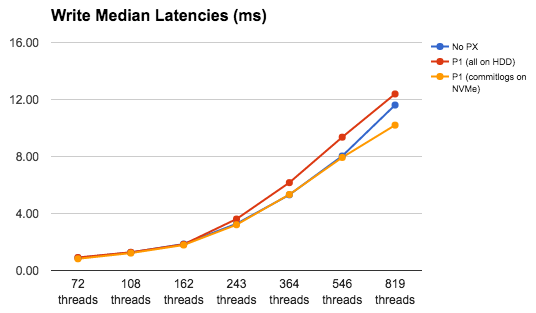
There is a similar story on latencies. And again, with a strategic placement of commitlogs we can reduce the latencies to even below those of bare metal.
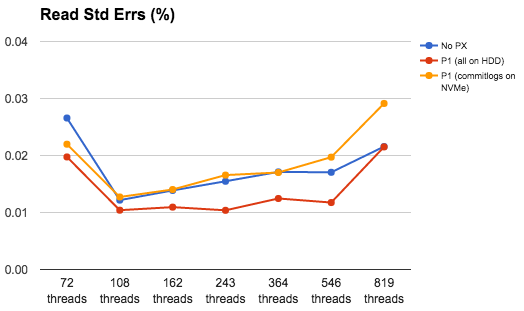
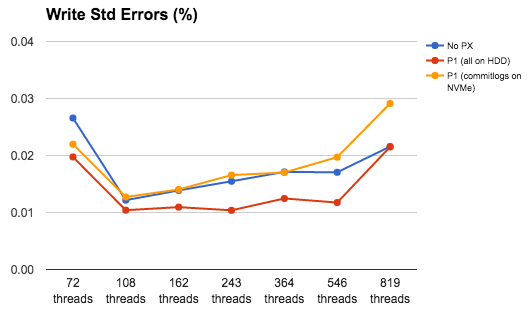
This was a bit of a surprise. With PX, I was expecting that with a lower rate of ops, we could achieve lower errors too. That seemed to be the case. But then with the splitting of commitlogs, somehow that didn’t work out to be better than in the case where everything is on HDDs. Worse, the errors are higher than in the baremetal too. This needed more investigation.
With that overall feel for baremetal versus PX numbers let’s see what happens when we switch between different combinations of replication factors. Do we see some trends?
P1/P2/P3 – Portworx volume replication = 1/2/3
C1/C2/C3 – Cassandra replication = 1/2/3
This is where I was blown away! The orange line represents PX replication = 3 and Cassandra replication = 1. We have higher rate of ops here! Much higher! I couldn’t believe this. I started suspecting some network glitches/bursts, disk throughput bursts, some form of artificial intelligence messing with me, end of the world, etc!
At the expense of adding extra hours (tearing down my setup mid-runs and setting up a config from a prev run type) just to make sure that we weren’t suddenly seeing any hardware/network improvement I re-tried older runs. And no! No such things! So I resumed to collect and analyze other metrics. (By the way, looking again at the above two graphs it is also interesting that the orange line didn’t seem to be saturating yet.)
This was amazing! So now I started thinking JVM issues and Cassandra Gossip vs Golang and PX gossip. As I was digesting that, it wasn’t surprising that we provided significant improvement in read latencies compared to our improvement in write latencies. Cassandra Read path is usually longer than the write path. With writes, there is not much difference because everything first goes to memory. Periodically Cassandra flushes from memory to disks. So even though write latencies should be similar, with higher rate of writes, Cassandra flushes more frequently and so we start seeing increased latencies. But now with Cassandra replication taken out (or reduced) we were going straight to volumes where our performance seemed to be better. Everything looked rosy! But there must be some catch! And sadly nothing comes free. The graphs below confirm that.
Here is where the middle ground of PX replication = 2 and Cassandra replication = 2 becomes serious enough to consider strongly. The errors are pegged down to nearly the same as when PX replication was 1 and Cassandra replication was 3. But the latencies and throughput are also as nearly good as with PX replication = 3 and Cassandra replication = 1
Wrapping Up
Does this all mean that we have to live with failures/errors? I’d look at it this way: Notice how the ops rates went up significantly. We achieved rates that with Cassandra replication = 3 and Portworx = 1 (or even without PX) we barely manage to hit (whatever your thread count). So in scenarios where your deployments have high ops rates, with PX in place you, at least, can start achieving those numbers. This may mean tweaks to your applications to re-write upon errors. So if you were able to handle 10000 ops and if 3 of them would typically error out, now you can achieve 30000 ops and you’d see 4 errors. You’d effectively have to handle that one extra write/read for the 20000 extra writes/reads that you are able to achieve!
In conclusion, these interesting numbers show that we can definitely bring a very high throughput to the table and low latency. We also have solutions to mitigate certain kind of failures that start showing up with changes to replication factors. With more tuning, I’m sure we could show even better performance. It’s a great product, and I’ve only been here a few weeks to test it out.
Thanks Ankit, Venkat, Gou, Eric, Jeff and Vinod for this opportunity!
Share
Subscribe for Updates
About Us
Portworx is the leader in cloud native storage for containers.
Thanks for subscribing!