


As customers expand their usage of cloud native technologies, they are looking for ways to use the resources in efficient ways by sharing both the compute (e.g. Kubernetes) and storage (e.g. Portworx) platform across multiple teams (groups) and users. The operations teams are looking for a mechanism to distribute/allocate costs associated with operating these platforms across the teams by ‘charging them back’ for their use of the platform.
But, before they can ‘charge back’, the first step is to collect the information and present it to the application teams i.e. ‘show back’. Breaking it down further, there are three steps for operation teams to enable chargeback for end users:
Using namespaces in Kubernetes is one way to isolate workloads or applications and then measure the CPU and memory consumption to attribute usage of the platform. There is no way to do that for storage since it is not namespace bound. However, given the deep intersection between Kubernetes and Portworx, we now have a way to do this.
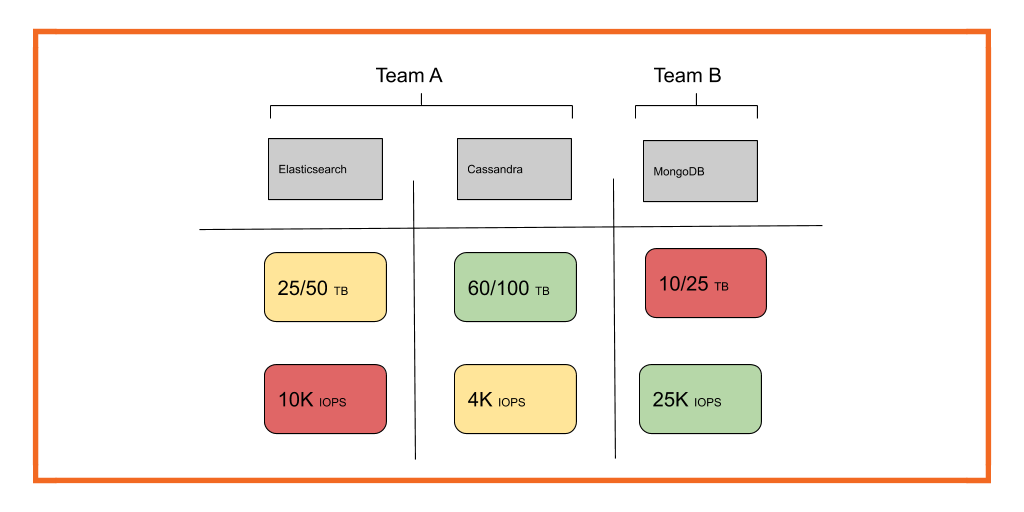
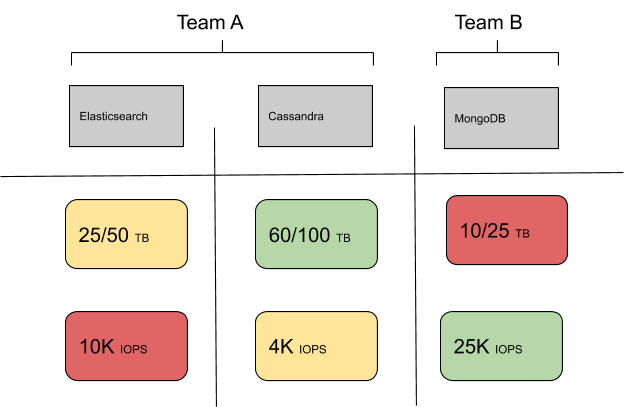
The example below shows how customers want to see the usage of resources divided. One way to do it is simply by ‘teams’ or ‘groups’ and mapping each team to a namespace. The other way is to do it by ‘workload’ or ‘application’ and mapping each application to a namespace. Portworx Volumes can then be associated with namespaces for mapping teams or applications to the volumes. Alternatively, there can be a direct mapping from volumes to applications or users as well (in situations where there is no concept of ‘namespace’).
Portworx volumes have always supported inheriting labels from parent PVCs. For example, if you have an application “foo” and the underlying PVCs have been labeled accordingly, you will see the same label on associated PX volume by doing volume inspect:
[root@node1 ~]# pxctl v i foo
Volume : 1045136508448473154
Name : foo
Size : 1.0 GiB
Format : ext4
HA : 1
IO Priority : LOW
Creation time : Apr 16 22:40:53 UTC 2019
Shared : no
Status : up
State : Attached: 129f2c29-0ddc-4ab6-824a-aec44acfb9c2 (70.0.95.96)
Device Path : /dev/pxd/pxd1045136508448473154
Labels : app=foo
Reads : 301
Reads MS : 3004
Bytes Read : 7536640
Writes : 5
Writes MS : 78
Bytes Written : 24576
IOs in progress : 0
Bytes used : 360 KiB
Replica sets on nodes:
Set 0
Node : 70.0.95.98 (Pool 0)
Replication Status : Up
If the labels are not automatically inherited, you can also apply labels using the volume update command. Here is an example of adding a new label for the same volume to denote a production environment.
[root@node1 ~]# pxctl v update --label env=prod foo
Update Volume: Volume update successful for volume foo
This new label also shows up in volume inspect.
[root@node1 ~]# pxctl v i foo
Volume : 1045136508448473154
Name : foo
Size : 1.0 GiB
Format : ext4
HA : 1
IO Priority : LOW
Creation time : Apr 16 22:40:53 UTC 2019
Shared : no
Status : up
State : Attached: 129f2c29-0ddc-4ab6-824a-aec44acfb9c2 (70.0.95.96)
Device Path : /dev/pxd/pxd1045136508448473154
Labels : app=foo,env=prod
Reads : 301
Reads MS : 3004
Bytes Read : 7536640
Writes : 5
Writes MS : 78
Bytes Written : 24576
IOs in progress : 0
Bytes used : 360 KiB
Replica sets on nodes:
Set 0
Node : 70.0.95.98 (Pool 0)
Replication Status : Up
With new updates in Portworx Enterprise 2.1.2, we are now able to see these same labels exposed via metrics API.
px_volume_currhalevel{cluster="px-cluster-9fe14e2c-a117-4c25-a48f-11da86810c9f",node="node1",node_id="129f2c29-0ddc-4ab6-824a-aec44acfb9c2",volumeid="1045136508448473154",volumename="foo", app="foo", env ="prod"} 1
Prometheus will now pick up these labels and you can visualize them in Grafana or set alert rules using Alertmanager. Below is an extension to the above example where there are three teams and two applications.
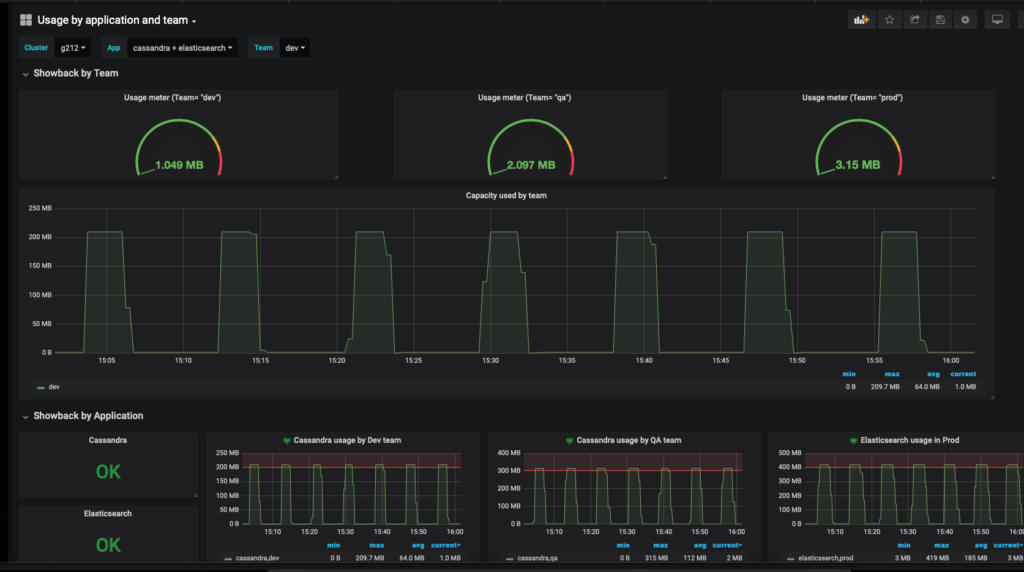
Example of Grafana Dashboard that shows usage by teams and by application type using volume metric labels
Portworx is also integrated with Datadog for monitoring as described here previously. Since this integration uses Prometheus, showback using metric labels also automatically works for Datadog users. As an example shown below, we used Kubernetes namespace labels that were applied to Portworx Volumes and we can use them to see usage by namespace (e.g. Elasticsearch).
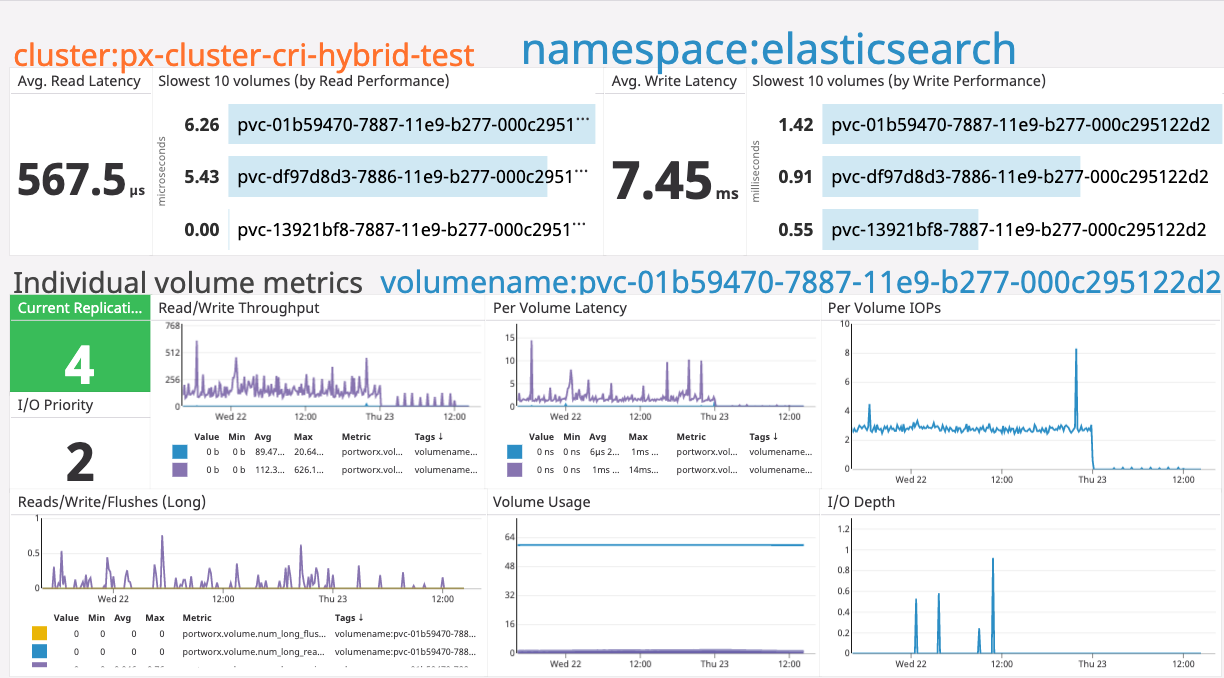
Example in Datadog to see volume labels with Kubernetes namespace
As illustrated in this blog, it is very easy to create intuitive dashboards to understand capacity used by teams or applications using your existing monitoring tools. This information is also available using metrics APIs to integrate into your existing chargeback models. If you have any questions or feedback, please reach out through Slack.