I recently had a customer ask about performance testing of MongoDB on Portworx, so I built out a deployment model and a test methodology for generating data and running load simulations against the MongoDB Community Edition on Portworx. In this post I’ll walk through how you can set up your own environment, build test data and run load tests.
Infrastructure Setup
For this testing, let’s build a 3-node zonal cluster in Google Cloud with nodes in Canada, 100GB SSDs, 4 CPU, and 16 GB memory nodes. I used the Ubuntu image, with autoscaling enabled with max nodes set to 6 to keep the cost low. We will deploy Portworx 2.9 on top of the GKE deployment.
For a GKE deployment, you’ll need to install the most recent gcloud sdk on your machine. I’m using a Mac.
Start with setting the project name, region, and zone:
export PROJECT_NAME=mongodb-testing
gcloud config set project $PROJECT_NAME
gcloud config set compute/region northamerica-northeast1
gcloud config set compute/zone northamerica-northeast1-a
I built my cluster from the command line:
gcloud container clusters create px-mongo1 \
    --zone northamerica-northeast1-a \
    --disk-type=pd-ssd \
    --disk-size=100GB \
    --labels=portworx=gke \
    --machine-type=n2-standard-4 \
    --num-nodes=3 \
    --image-type ubuntu \
    --scopes compute-rw,storage-ro \
    --enable-autoscaling --max-nodes=6 --min-nodes=3
Once the cluster finishes deploying, let’s get a Kubeconfig rolling:
gcloud config set container/cluster px-mongo1
gcloud container clusters get-credentials --region northamerica-northeast1-a px-mongo1
Deploy Portworx
We’ll need to create a ClusterRoleBinding to allow access to the K8s environment. Notice the syntax here; if you’re using fish shell, you might have to edit some of these commands to make sure they work:
kubectl create clusterrolebinding px-mongo1-admin-binding \
    --clusterrole=cluster-admin \
    --user=`gcloud info --format='value(config.account)'`
Now that the cluster is created and the permissions are set, let’s deploy the Portworx Operator and the StorageCluster. The command below will download a generated yaml file to deploy the operator:
curl -o px-operator.yaml 'https://install.portworx.com/2.9?comp=pxoperator'
vim px-operator.yaml # review the spec file
kubectl create -f px-operator.yaml
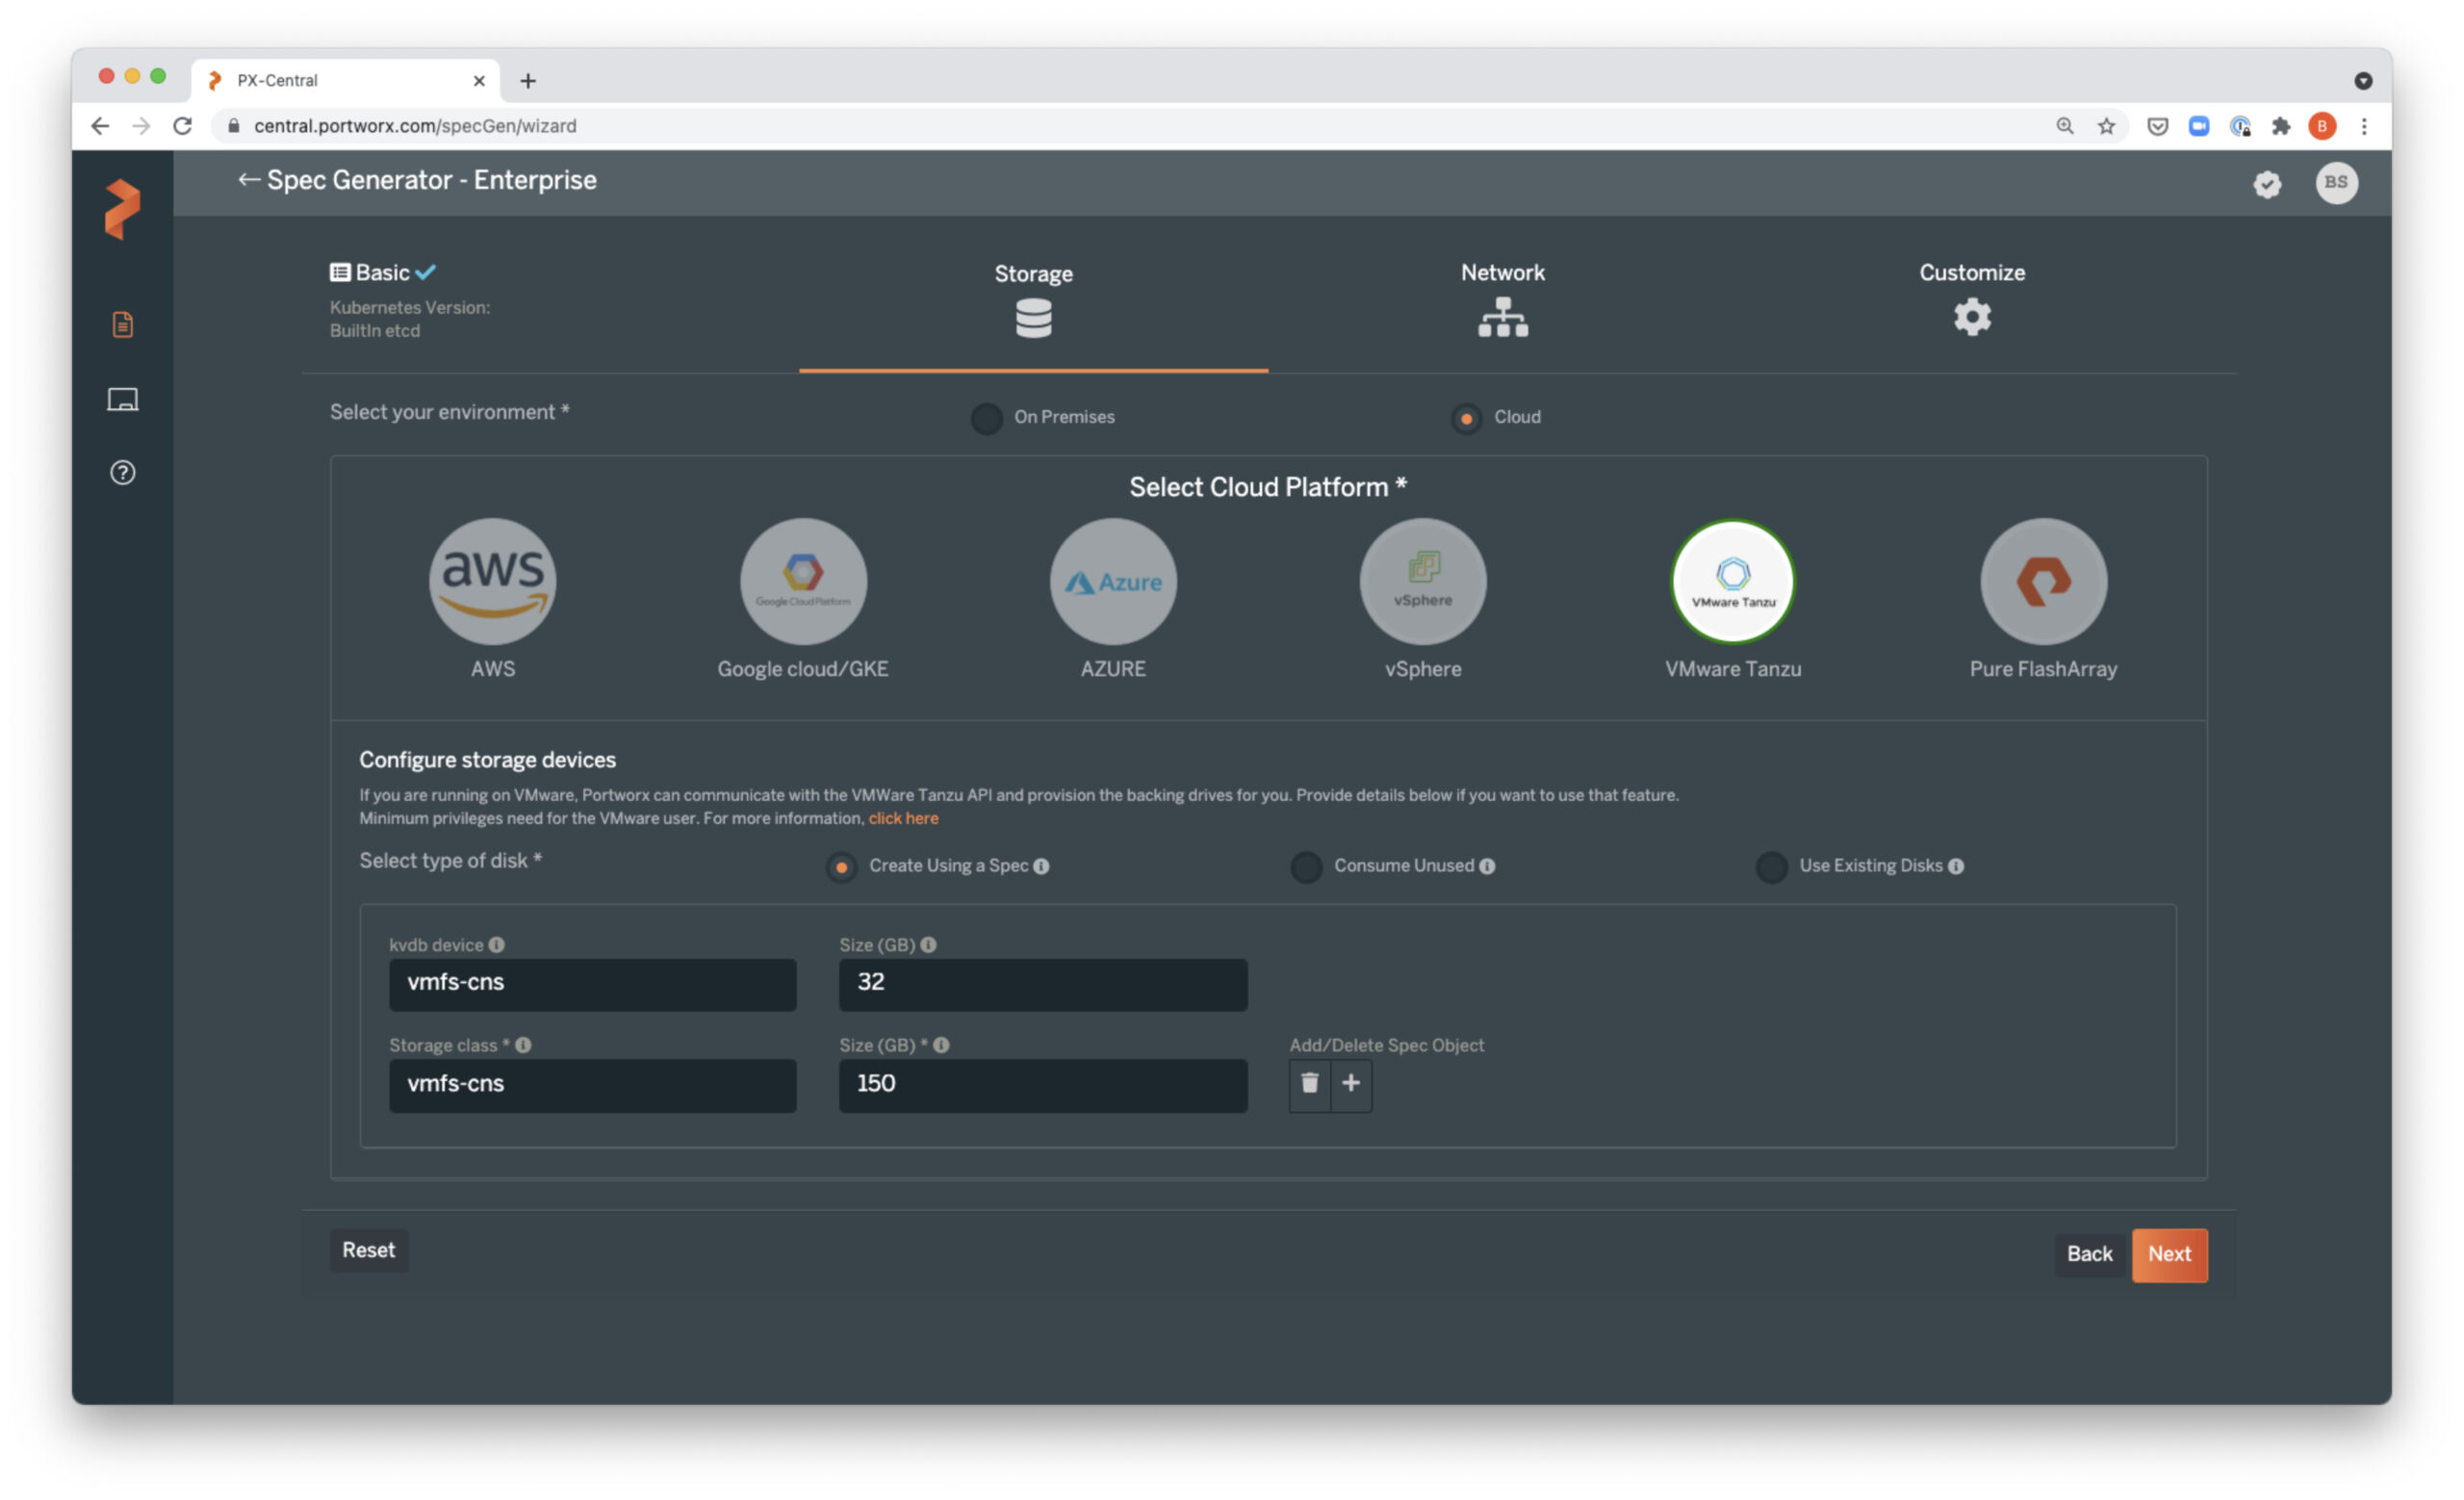
Once the Portworx Operator is up and running, we can download the StorageCluster spec and deploy. You can generate and download your own spec from PX-Central or use this one that will add two 150GB pd-standard disks to each worker node and use Portworx internal KVDB:
curl -o px-spec.yaml 'https://install.portworx.com/2.9?operator=true&mc=false&kbver=&b=true&kd=type%3Dpd-standard%2Csize%3D150&s=%22type%3Dpd-standard%2Csize%3D150%22&j=auto&c=px-cluster-0ac157ca-e638-4d9e-8d4f-3c1d2a4c718c&gke=true&stork=true&csi=true&mon=true&tel=true&st=k8s&promop=true'
vim px-spec.yaml # always review a file before applying

kubectl create -f px-spec.yaml
Take note here: You can definitely put Portworx in a different namespace if you would like. For speed and ease, I’ve just installed the Operator and StorageCluster into a kube-system default namespace.
Prometheus / Grafana Config
To monitor the environment, you’ll want to deploy Prometheus configs and Grafana dashboard configs. You can follow the official Portworx documentation here. The commands below are a shortcut:
kubectl create -f service-monitor.yaml
kubectl create -f prometheus-rules.yaml
kubectl create -f prometheus-cluster.yaml
kubectl -n kube-system create configmap grafana-dashboard-config --from-file=grafana-dashboard-configmap.yaml
kubectl -n kube-system create configmap grafana-source-config --from-file=grafana-datasource.yaml

curl "https://docs.portworx.com/samples/k8s/pxc/portworx-cluster-dashboard.json" -o portworx-cluster-dashboard.json && \
curl "https://docs.portworx.com/samples/k8s/pxc/portworx-node-dashboard.json" -o portworx-node-dashboard.json && \
curl "https://docs.portworx.com/samples/k8s/pxc/portworx-volume-dashboard.json" -o portworx-volume-dashboard.json && \
curl "https://docs.portworx.com/samples/k8s/pxc/portworx-etcd-dashboard.json" -o portworx-etcd-dashboard.json
kubectl -n kube-system create configmap grafana-dashboards --from-file=portworx-cluster-dashboard.json --from-file=portworx-node-dashboard.json --from-file=portworx-volume-dashboard.json --from-file=portworx-etcd-dashboard.json

kubectl apply -f grafana.yaml
This creates a Grafana instance that is internally plumbed but has no external access. We could give external access, but to keep it simple for my testing, I’ve just done a “port-forward” in another terminal to access the grafana instance:
kubectl -n kube-system port-forward svc/grafana 3000:3000
You can now access Grafana on the system you are running the port forward from. Open a new browser window and navigate to http://localhost:3000. The initial install will let you log in with “admin/admin” and ask you to change your password. This will only be internal facing, but I would still recommend changing to something secure.
MongoDB Community Install
I chose to install the MongoDB Kubernetes Community Operator install. This installs a Kubernetes Operator and creates a number of CRDs. The full documentation for the install is here. The condensed list of operations below takes MongoDB’s community operator repo; applies the CRDs, ClusterRoles, ClusterRoleBindings, and ServiceAccounts; and deploys the operator.
# from your working directory
git clone https://github.com/mongodb/mongodb-kubernetes-operator.git
kubectl apply -f config/crd/bases/mongodbcommunity.mongodb.com_mongodbcommunity.yaml
kubectl get crd/mongodbcommunity.mongodbcommunity.mongodb.com # check CRDs got made
kubectl create ns mongodb
kubectl apply -f config/rbac/ -n mongodb # create roles and bindings
kubectl get role mongodb-kubernetes-operator --namespace mongodb
kubectl get serviceaccount mongodb-kubernetes-operator --namespace mongodb
kubectl get serviceaccount mongodb-database --namespace mongodb
kubectl create -f config/manager/manager.yaml --namespace mongodb # create operator
kubectl get po -n mongodb # check operator installed fine
Deploy CRDs and ReplicaSet
Once the Operator is installed, we can go ahead and deploy MongoDB. First, copy the sample config to a new directory:
cp mongodb-kubernetes-operator/config/samples/mongodb.com_v1_mongodbcommunity_cr.yaml .
Edit this file to update the “your-password-here” item in the secret section of the file.
The other edit required is not completely obvious if you’re not already a MongoDB user. The default user that is created does not have the privileges required to create and write to new databases. The final deployment file should look like this:
---
apiVersion: mongodbcommunity.mongodb.com/v1
kind: MongoDBCommunity
metadata:
  name: example-mongodb
spec:
  members: 3
  type: ReplicaSet
  version: "4.2.6"
  security:
    authentication:
      modes: ["SCRAM"]
  users:
    - name: my-user
      db: admin
      passwordSecretRef: # a reference to the secret that will be used to generate the user's password
        name: my-user-password
      roles:
        - name: clusterAdmin
          db: admin
        - name: userAdminAnyDatabase
          db: admin
        - name: root
          db: admin
      scramCredentialsSecretName: my-scram
  additionalMongodConfig:
    storage.wiredTiger.engineConfig.journalCompressor: zlib

# the user credentials will be generated from this secret
# once the credentials are generated, this secret is no longer required
---
apiVersion: v1
kind: Secret
metadata:
  name: my-user-password
type: Opaque
stringData:
  password: p0rtworx21
As mentioned above, change your password to whatever you would like. The “name: root” section is what needs to be added to give the user full access.
Create a StorageClass for MongoDB
MongoDB’s caching system, WiredTiger, is not a big fan of ext4, which is the default for Portworx volumes. MongoDB works better on xfs. There are a couple of other features of Portworx volumes we want to leverage. We will change io_profile to db_remote, cow_ondemand to true, and disable_io_profile_protection to 1 because we are using only two replicas with the db_remote profile.
The db_remote IO profile implements a write-back flush coalescing system. This means that syncs occurring within a 50ms window will get put together into one sync. These coalesced syncs are acknowledged only when copied to all replicas. Full details of IO profiles in Portworx can be found here.
The cow_ondemand parameter set to “true” enables on-demand Copy on Write on the volume.
kind: StorageClass
apiVersion: storage.k8s.io/v1
metadata:
  name: px-mongodb-sc
provisioner: kubernetes.io/portworx-volume
parameters:
  repl: "2"
  cow_ondemand: "true"
  io_profile: "db_remote"
  disable_io_profile_protection: "1"
  fs: xfs
allowVolumeExpansion: true
In Google Cloud, the default StorageClass will be set to “standard.” Since we’re really just interested in testing MongoDB, change the default StorageClass to the new px-mongodb-sc:
kubectl patch storageclass standard -p '{"metadata": {"annotations":{"storageclass.kubernetes.io/is-default-class":"false"}}}'
kubectl patch storageclass px-mongodb-sc -p '{"metadata": {"annotations":{"storageclass.kubernetes.io/is-default-class":"true"}}}'
Now we can deploy the MongoDB ReplicaSet and have MongoDB start up:
kubectl apply -f mongodb.com_v1_mongodbcommunity_cr.yaml -n mongodb
watch kubectl get po -n mongodb # or consider using k9s and watch the ns
Get MongoDB Credentials (#get-mongodb-credentials)
By default, the community operator will create secrets for access to DBs. In the sample yaml we use from Mongo, it creates a secret called “example-mongodb-admin-my-user.” “example-mongodb” is the name of the MongoDB database resource. “admin” is the authentication database where the user is defined, and “my-user” is the name of the database user.
Run the command below to retrieve the credentials and connection strings. Note, “jq” is required; install it as a package on your system or make an alias to run a jq container.
kubectl get secret example-mongodb-admin-my-user -n mongodb \
    -o json | jq -r '.data | with_entries(.value |= @base64d)'
I used “p0rtworx21” as my password, so the output of the command looked like this for me:
{
  "connectionString.standard": "mongodb://my-user:p0rtworx21@example-mongodb-0.example-mongodb-svc.mongodb.svc.cluster.local:27017,example-mongodb-1.example-mongodb-svc.mongodb.svc.cluster.local:27017,example-mongodb-2.example-mongodb-svc.mongodb.svc.cluster.local:27017/admin?ssl=false",
  "connectionString.standardSrv": "mongodb+srv://my-user:p0rtworx21@example-mongodb-svc.mongodb.svc.cluster.local/admin?ssl=false",
  "password": "p0rtworx21",
  "username": "my-user"
}
Keep this somewhere safe—it’s required for the performance testing!
Performance Test Setup
All the work we have done so far has been to make it possible to run performance tests. Many other data services platforms provide their own performance test harnesses, but MongoDB appears not to have an “official” testing tool. I decided to use YCSB, which is a project that was built a long time ago but continues to be updated. YCSB provides the ability to generate and load data into a database based on specific test scenarios and then run those test scenarios. You can find more details about YCSB here.
In my test environment, I created a pod to run YCSB:
apiVersion: v1
kind: Pod
metadata:
  labels:
    name: ycsb
  name: ycsb-pod
  namespace: mongodb
spec:
  containers:
    - image: docker.io/vaelinalsorna/centos7_yscb_mongo-shell:0.1
      imagePullPolicy: IfNotPresent
      name: ycsb-pod
      resources:
          limits:
            memory: 512Mi
      securityContext:
        capabilities: {}
        privileged: false
      terminationMessagePath: /dev/termination-log
  restartPolicy: OnFailure
  nodeSelector:
  serviceAccount: ""
status: {}
Once I applied this pod definition, I found that the YCSB tool and the mongosh binaries need to be updated for the latest version of MongoDB. Once the pod is up and running, I opened a shell (I use k9s for this, but you could kubectl exec) in the pod and downloaded the appropriate updates:
# change to the path of your choosing
cd test-path
curl -O --location https://github.com/brianfrankcooper/YCSB/releases/download/0.17.0/ycsb-0.17.0.tar.gz
tar xfvz ycsb-0.17.0.tar.gz
curl -O https://downloads.mongodb.com/compass/mongodb-mongosh-1.1.2.el7.x86_64.rpm
yum install ./mongodb-mongosh-1.1.2.el7.x86_64.rpm
mongosh -u my-user -p p0rtworx21 mongodb+srv://my-user:p0rtworx21@example-mongodb-svc.mongodb.svc.cluster.local/admin?ssl=false # optional to test connectivity
Note that during my testing, the pod stayed up and running, so I had no issues, but if the pod crashes or is deleted, the tools will need to be upgraded again.
Database Loading
Before running performance tests, we need to use YCSB to load data into MongoDB. I used the “workloadb” dataset. Workload B is a 95:5 read:write IO mix. The command below will generate and load the dataset and be prepared for a test with 4 million records and 1 million operations. Replace “test-path” with the path to the new yscb binary. The “mongodb.url” parameter should be changed to the connection string collected in the earlier step: Get MongoDB Credentials (#get-mongodb-credentials).
kubectl -n mongodb exec ycsb-pod -- \
  ./test-path/ycsb load mongodb -s -threads 2 \
  -P "workloads/workloadb" \
  -p mongodb.url=mongodb://my-user:p0rtworx21@example-mongodb-0.example-mongodb-svc.mongodb.svc.cluster.local:27017,example-mongodb-1.example-mongodb-svc.mongodb.svc.cluster.local:27017,example-mongodb-2.example-mongodb-svc.mongodb.svc.cluster.local:27017/admin?ssl=false \
  -p recordcount=4000000 \
  -p operationcount=1000000 \
  -p requestdistribution=uniform \
  -p wtimeout=10000 \
  -p core_workload_insertion_retry_limit=5 \
  -p core_workload_insertion_retry_interval=5 \
  -p maxexecutiontime=28800
The data load will take time. Running the data load takes up significant memory and CPU resources. If you find the data load fails, take a look at your node pool resources; it’s entirely possible that your nodes don’t have enough memory. You can choose to scale out the capacity of your nodes, or you can shrink the size of the operations in the ycsb command. Note that on Google Cloud, if you deploy a new node pool, you want to check the “All Cloud API Access” option under “Security.”
I recommend watching Grafana dashboards while the data load is running. You will see valuable information about how your environment performs—the type of latency with each volume and what IOPs look like for each volume and across the cluster. When the data load completes, YCSB will output data about the load. Pay attention to the number of operations and average/min/max latency.
Running a Load Test
Now that data is loaded into the MongoDB database, you can run load tests. Running a test is similar to the load command. Again, replace “test-path” with the path new ycsb tools were extracted to, and change the “mongodb.url” value to your mongodb connection string:
kubectl -n mongodb exec ycsb-pod -- \
  ./test-path/ycsb run mongodb -s -threads 2 \
  -P "workloads/workloadb" \
  -p mongodb.url=mongodb://my-user:p0rtworx21@example-mongodb-0.example-mongodb-svc.mongodb.svc.cluster.local:27017,example-mongodb-1.example-mongodb-svc.mongodb.svc.cluster.local:27017,example-mongodb-2.example-mongodb-svc.mongodb.svc.cluster.local:27017/admin?ssl=false \
  -p recordcount=4000000 \
  -p operationcount=1000000 \
  -p requestdistribution=uniform \
  -p wtimeout=10000 \
  -p writeallfields=true \
  -p maxexecutiontime=18000
When this load test completes, you will have data captured in Prometheus/Grafana as well as the output of YCSB. There will be lots of data to review and compare, which will help you think about how you might want to tweak the performance of your environment.
Share
Subscribe for Updates
About Us
Portworx is the leader in cloud native storage for containers.
Thanks for subscribing!

Chris Saunders
Cloud Architect | Cloud Native BU, Pure StorageExplore Related Content:
- databases
- kubernetes
- portworx