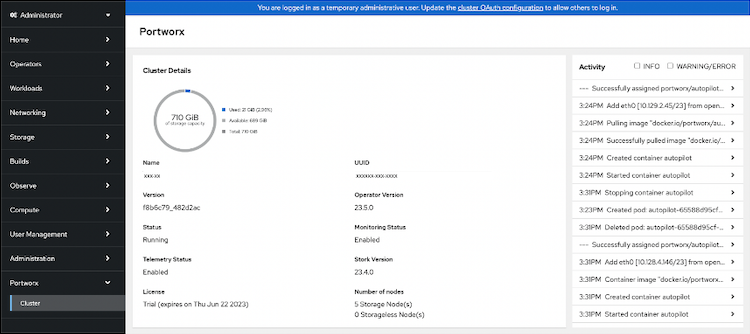
Platform Engineers have to multitask on a daily basis, so toggling between two different interfaces to visualize their OpenShift storage can impact productivity. It also adds unnecessary technical debt when two different products have to be used. Monitoring storage within the same Web Console used to deploy and manage OpenShift containers and virtual machines simplifies storage management while making Platform Engineers more productive.
To increase Platform Engineering productivity while assuring critical storage components are at their fingertips, Portworx now integrates with the OpenShift Web Console.
By using the Red Hat OpenShift Dynamic Console Plugin, Portworx is able to visually represent all aspects of Portworx storage including cluster level, volume and storage class views seamlessly within the OpenShift Web Console.

Figure 1 – Portworx storage reporting within the OpenShift web console
The single-pane view of Portworx storage within OpenShift provides details such as persistent volume inventory and claims, volume sizing, and utilization along with warning, error and informational messages.
Get Started Now
Portworx Operator 23.5.0 or newer is required as is OpenShift 4.12 or higher. The step-by-step process to enable the console plugin can be found here along with a new technical blog that covers implementation of the plug-in.