Get hands-on with OpenShift + Portworx at your own pace Try it Free

Photo by Alina Grubnyak on Unsplash
“Edge computing” is like many buzzwords and acronyms that are readily used in today’s cloud computing world. An example would be the Internet of Things, or “IoT,” which is a little convoluted by nature since it describes nearly anything connected to the internet. One thing we know for certain is that over time, large powerhouses of computers have evolved from mainframe computers to cloud computing, and with the advent of smaller computing devices that live with us or in our homes, we see computing everywhere, including at the “edge.” These “things”—such as cell phones, smart thermostats, and cloud-based voice services devices (like Alexa)—all fall under the IoT umbrella because most of them connect back to the internet and, in most cases, to cloud computing in order to process some type of data. “Edge” computing is really about trying to enable that data to be processed closer to the source of the data itself (basically, at the edge), rather than within the core cloud compute resources. This reduces reliance on data traveling long distances on the network and, quite possibly, enabling an overall better experience for the end consumer by reducing latency, increasing bandwidth, and improving overall security.
How can Portworx enable your edge applications?
Portworx is especially valuable at the edge because this is where data is increasingly collected via IoT devices, initially analyzed, and subsequently sent to the core data center for additional processing. At their core, these edge-driven processes require:
- Storage performance
- Data protection
- Capacity management
- Data security
Edge applications need these things without an extensive resource footprint—and that is the core value proposition of Portworx’s lightweight yet robust software-defined platform.
Example use case of Portworx at the edge
The example we will use to demonstrate Portworx used at the edge will focus on data streaming. Specifically, very small amounts of sensor data from edge devices such as custom thermostats that measure temperature and humidity will be streamed from a Portworx-enabled edge device to a “core” datacenter where Portworx is running on GPU-enabled Kubernetes for machine learning.
Note: Portworx is lightweight enough to run in an “Edge” datacenter or in a datacenter that is closer to the end users. There are many architectural choices when it comes to providing services for IoT. In this case, we are highlighting how you may use Sharedv4 service volumes from a Portworx enabled data center, whether that is an edge data center or core data center with the appropriate levels of security for shared service volumes. This blog is not a production recommendation on architecture and more a showcase of how Sharedv4 Service Volumes work.
If you have a Google Nest thermostat in your home, this is similar to that, except this rudimentary device is built from a Raspberry Pi 2, which has some basic indicator lights and a DHT22 sensor, which captures temperature and humidity data.
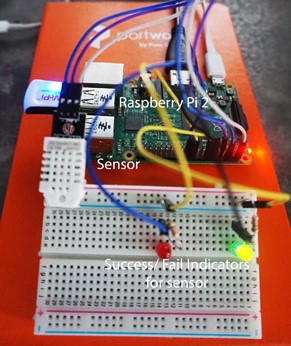
At the edge, this sensor sits in an office capturing the temperature and humidity of the office throughout the day. The sensor has a small program that runs on the compact compute device the sensor is connected to. This small program represents some basic edge computing that is done, and, in this case, it does some simple scrubbing and validation of data before writing it to a Portworx shared edge volume. For this set up this makes sense because we are writing small amounts of data every day and not producing massive amounts of data. In the later case it would make more sense for your “core” Portworx cluster to be deployed closer to the edge as well and then provide sharedv4 ingest for devices as there would be a need for more computing power at the edge as well latencies for the amount of data produced.
The Portworx volume provided to this edge compute device is connected via the Portworx Shared Volume Service, which is a Portworx feature as of 2.8.0, which provides internally or externally accessible shared volumes with access controls and the added benefit of high availability of the shared volume service itself. With this feature enabled, if the sharedv4 (NFS) server goes offline and requires a failover, application pods won’t need to restart.
The clustered, scale-out, multi-PB shared volume service makes Portworx ideal for connecting IoT devices at the edge to Kubernetes clusters. Since shared volumes are multi-reader/writer, after the sensor data is processed at the edges and written to the Portworx volume, a second process in the core data center is reading the data from the volume as it streams. This process presents and graphs the raw data as well as utilizes the GPU-enabled EKS cluster that Portworx is running on at the core to create machine learning LSTM models to run prediction on future temperatures in the office. Below you can see a rough diagram of the architecture.
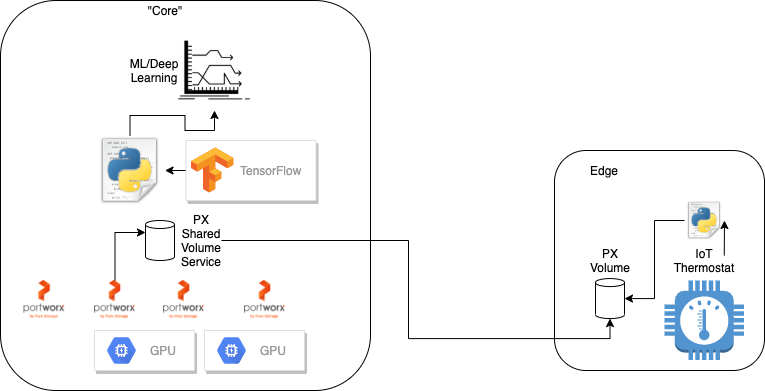
To create a Portworx shared volume with the service enabled, you first need to create a StorageClass that enables it by using the sharedv4_svc_type parameter. See the example below.
##### Portworx storage class
kind: StorageClass
apiVersion: storage.k8s.io/v1
metadata:
  name: px-edge-sc-v4
provisioner: kubernetes.io/portworx-volume
parameters:
  repl: "2"
  sharedv4: "true"
  sharedv4_svc_type: "LoadBalancer"
  allow_ips: "192.168.101.101,192.168.101.102,192.168.101.103,45.13.123.101"
  export_options: "insecure"
allowVolumeExpansion: true
Then, simply create a PVC from this StorageClass.
---
##### Portworx persistent volume claim
kind: PersistentVolumeClaim
apiVersion: v1
metadata:
  name: px-edge-pvc
spec:
  storageClassName: px-edge-sc-v4
  accessModes:
    - ReadWriteMany
  resources:
    requests:
      storage: 100Gi
You should then be able to view your services in the namespace where the PVC lives and see the shared volume service available.
$ kubectl get svc
NAME                           TYPE           CLUSTER-IP      EXTERNAL-IP                                                               PORT(S)                          AGE
px-667534991996680799-server   LoadBalancer   10.100.16.87    a206ad6c73262346234623461-93923623.us-east-1.elb.amazonaws.com    2049:32529/TCP,20048:32398/TCP   19d
Using pxctl, you should also see this volume reported as a “v4 (service)” enabled volume.
$ pxctl v l

ID               NAME     SIZE   HA   SHARED

667534991996680799  pvc-78a…  100 GiB   2   v4 (service)
Then, as long as you set up your access controls correctly, your edge device can mount the Portworx volumes with a standard mount command, such as the below example. First, retrieve the mount options from the volume using pxctl.
$ pxctl v i 667534991996680799 | grep "Client Mount Options"

Sharedv4 Client Mount Options:  port=2049,proto=tcp,retrans=8,soft,timeo=600,vers=3.0,actimeo=60,mountport=20048
Then, issue the mount on the client node.
mount -t nfs -o mountport=20048,port=2049,timeo=600,vers=3.0,actimeo=60,proto=tcp,retrans=8,soft <LoadBalancer>:/var/lib/osd/pxns/<volume_id> /mnt/your_mountpoint/
After the Portworx volume is mounted on your edge device, it can be written to. In our casem our sensor data is written to this volume on the Raspberry.
Using GPU-enabled core to build LSTM models for predictions
Once our data is streamed from the edge sensor to the Portworx shared service volume, it becomes available in our core datacenter where the main Portworx cluster resides. For the purposes of this demo, this cluster is an Amazon EKS cluster that uses P3 instance types to provide GPUs to our Portworx cluster. The EKS cluster is then able to schedule GPUs to deployments that utilize them. In this case, we have built a basic Keras python application that uses Tensorflow to produce Long Short-Term Memory layer models on the time-series temperature data collected from the edge to try and predict temperature in the near future.
The application allows a user to do two things: view current streaming data and run prediction on streaming data.

When live data is viewed, it simply displays the current temperature and humidity data over the configured time frame—in this case, about 2 weeks.
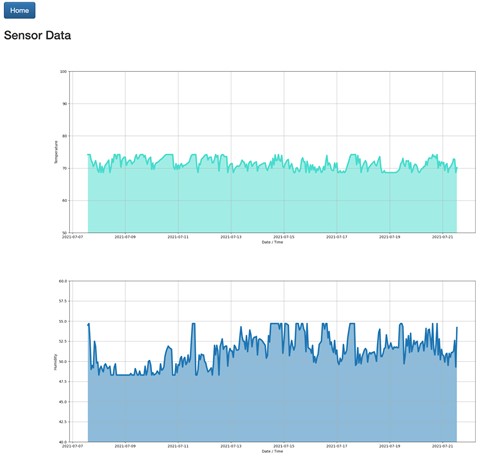
When a prediction is run, the Keras and Tensorflow detect the availability of the GPU within the PoD and use it for creating the model.
2021-07-06 18:44:20.177938: I tensorflow/core/common_runtime/gpu/gpu_device.cc:1418] Created TensorFlow device (/job:localhost/replica:0/task:0/device:GPU:0 with 14644 MB memory) -> physical GPU (device: 0, name: Tesla V100-SXM2-16GB, pci bus id: 0000:00:1e.0, compute capability: 7.0)
We can see our python program is using the GPU by using the nvidia-smi tool available from one of the GPU nodes.
$ nvidia-smi
+-----------------------------------------------------------------------------+
| NVIDIA-SMI 460.73.01    Driver Version: 460.73.01    CUDA Version: 11.2     |
|-------------------------------+----------------------+----------------------+
| GPU  Name        Persistence-M| Bus-Id        Disp.A | Volatile Uncorr. ECC |
| Fan  Temp  Perf  Pwr:Usage/Cap|         Memory-Usage | GPU-Util  Compute M. |
|                               |                      |               MIG M. |
|===============================+======================+======================|
|   0  Tesla V100-SXM2...  On   | 00000000:00:1E.0 Off |                    0 |
| N/A   40C    P0    47W / 300W |  15237MiB / 16160MiB |     14%      Default |
|                               |                      |                  N/A |
+-------------------------------+----------------------+----------------------+


+-----------------------------------------------------------------------------+
| Processes:                                                                  |
|  GPU   GI   CI        PID   Type   Process name                  GPU Memory |
|        ID   ID                                                   Usage      |
|=============================================================================|
|    0   N/A  N/A       357      C   python3                         15235MiB |
+-----------------------------------------------------------------------------+


[root@ip-192-168-29-252 ec2-user]# ps ax | grep predict
  357 ?        Sl    11:05 python3 predict.py
The application scrubs, scales, and splits the data into training data, then builds the LSTM model layers and produces a model that can be used to make predictions. Predictions are created by using future timestamps added to our dataset and running the model to predict a new temperature for that timestamp based on what it learned.
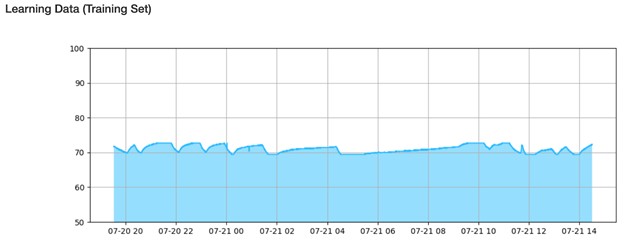
In the graph below, we can see the training dataset used in the prediction model, which is simply the raw data from the configured timestamps and is roughly one day’s worth of data points.
The red line in the graph below represents what the model learned based on the training data. This indicates that the LSTM model was able to learn the data within enough accuracy to follow a similar pattern.
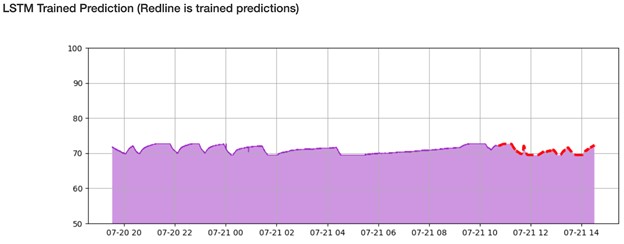
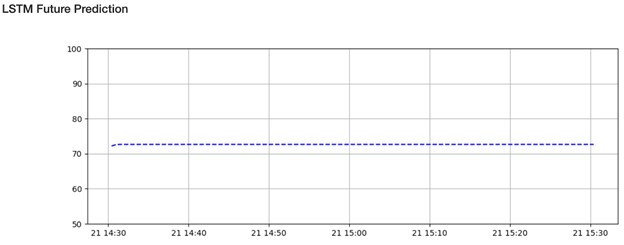
Then, for an hour into the future, the model tried to predict the temperature. In this case, it suggested a small rise in temperature from ~72F to ~74F until it flattened out. The predictions flatten mainly because, as time goes on, predictions naturally become less accurate and the overall accuracy of our machine learning model is far from perfect.
Below is a demonstration that walks through much of what this blog touched on, including the Portworx configuration and how it enables the shared volume service to be used by the edge sensor devices.
Conclusion
Kubernetes is quickly becoming the ideal compute orchestration platform for edge computing. With features around scaling, security, and agility, it offers plenty of benefits to IoT and edge application development. Kubernetes is still not enough when it comes to running these types of workloads, since many of them rely on durable, secure, and flexible data management. IoT, edge, artificial intelligence (AI), and machine learning gain storage performance, data protection, capacity management, and data security with Portworx—all at a small footprint that can work on any Kubernetes cluster. Whether it’s Anthos, Arc, Tanzu, K3s, or other solutions, Portworx can enable your edge workloads with a robust set of data management capabilities.
Credits
Credits to many of the resources available on Keras, Tensorflow, Kubernetes GPUs, and machine learning used in developing this example. This link provides the resources used.
Share
Subscribe for Updates
About Us
Portworx is the leader in cloud native storage for containers.
Thanks for subscribing!


