Portworx Enterprise is the Kubernetes Data Services Platform businesses trust to run mission-critical applications in containers in production on Red Hat OpenShift. Only Portworx provides a fully integrated solution for persistent storage, data protection, disaster recovery, data security, cross-cloud and data migrations, and automated capacity management for applications running on Kubernetes. As a result, Portworx is the #1 most used Kubernetes data services platform by Global 2000 companies, including Carrefour, Comcast, GE Digital, Kroger, Lufthansa, and T-Mobile.
In this blog, you’ll learn how to effectively use Portworx to monitor stateful applications on Red Hat OpenShift with Portworx.
With Red Hat OpenShift, DevOps teams and application owners can take advantage of easily scheduling application pods onto Kubernetes infrastructure. Application pods are placed onto the Kubernetes infrastructure based on labels, CPU and memory consumption, affinity rules, and topology. Applications also automatically get connected to networks and are provided with network services, such as load balancers. Stateful applications like databases and message queues are also provided with a persistent volume claim and persistent volume, which most likely connects to another data management system that controls the data and control path for volume operations.
There’s a lot that Kubernetes does, but the question we are looking to dive into is, how do you monitor applications—and specifically stateful applications—now that there are more layers and moving components in the application stack?
Using PX-Monitor to monitor stateful applications on Red Hat OpenShift
The Red Hat OpenShift monitoring stack uses tools such as Prometheus, Alertmanager, Node Exporter, and Grafana, much like the Portworx monitoring stack with PX-Central and PX-Monitor. These industry standard tools allow for a deep level of monitoring capabilities along with the flexibility of configuration for Kubenretes environments.
Let’s walk through how to set up and use monitoring for Red Hat OpenShift and Portworx when running stateful applications such as Postgres.
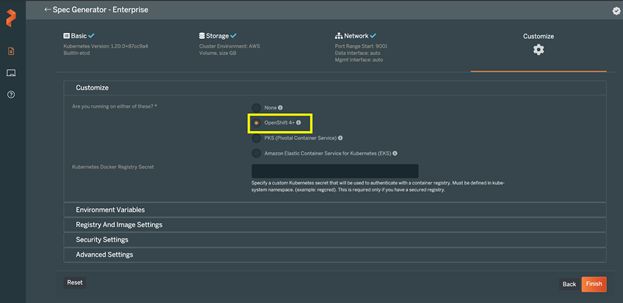
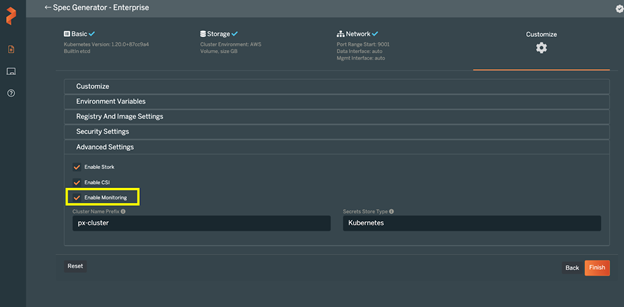
To get started, create our Portworx cluster spec on https://central.portworx.com. Make sure to select the Red Hat OpenShift box as well as “Enable Monitoring” under “Advanced Settings.” This will make sure your Portworx cluster is set up with the Prometheus operator that enables PX-Monitor to connect.
Once your Portworx cluster is installed, you will need to install two components to use PX-Monitor.
PX-Central UI: You can install this on the same or different cluster by using the PX-Backup Helm Chart from https://central.portworx.com.
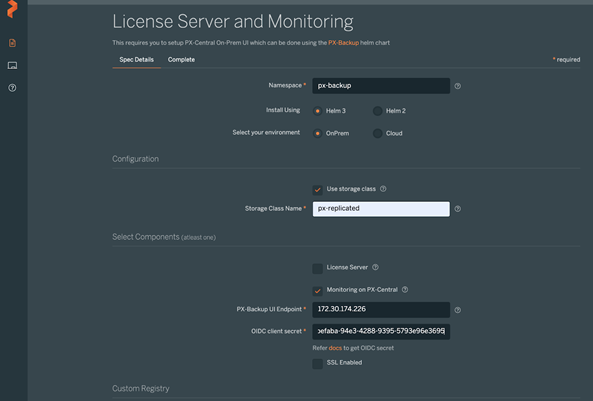
PX-Monitor: This can be installed by navigating to https://central.portworx.com and selecting “License Server and Monitoring,” then filling in the needed information, such as OIDC_CLIENT_SECRET, selecting the “Monitoring on PX-Central” box and providing the PX-Backup UI installed in step one. This endpoint should be Ingress, Load Balancer, or IP:PORT.
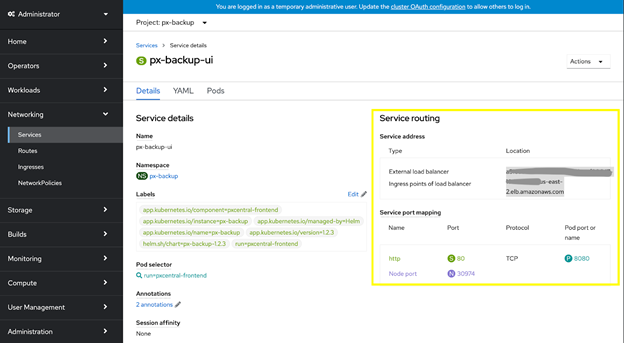
Once PX-Central and PX-Monitor are connected, head over to the Red Hat Openshift dashboard and navigate the px-backup namespace where the px-backup-ui service is available. This service will open the PX-Central interface for backup and monitoring.
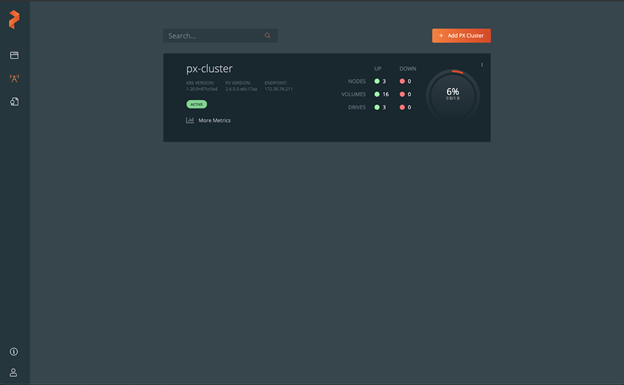
From here, your Portworx cluster should be connected to PX-Central; you can select “More Metrics” to bring you the full Grafana monitoring dashboards.
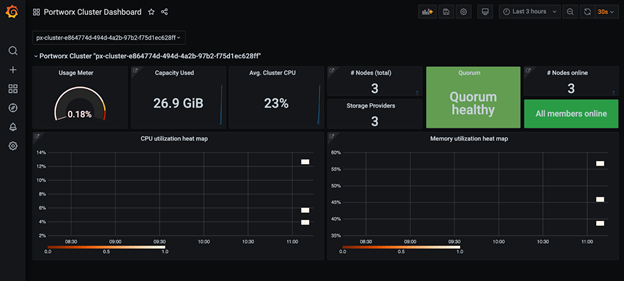
From here, the Portworx cluster, nodes, backup, and volumes dashboards can allow you to monitor your data management components of the Red Hat OpenShift cluster.
Monitoring Postgres
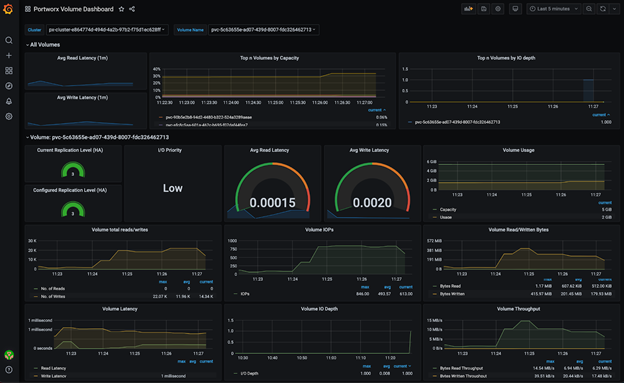
To monitor a specific stateful application, navigate to your application, such as this Postgres pod seen below, which is using a Portworx storage class. From here, copy the PersistentVolumeClaim name that the database is using.
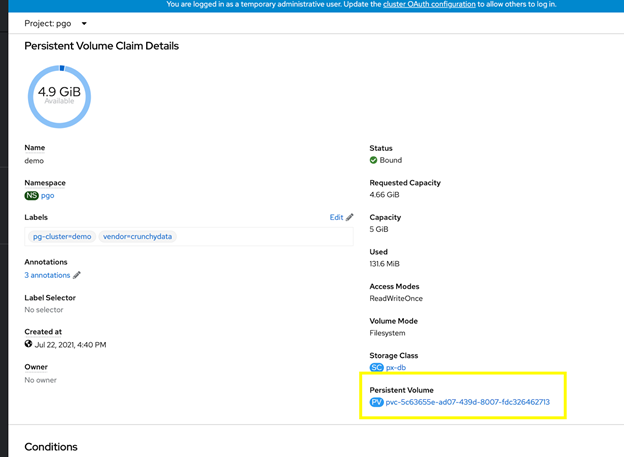
Then navigate to the Portworx Volume Dashboard.

Paste the PersistentVolumeClaim name into the “Volume Name” box.

Now you should be able to monitor Postgres volume metrics from the Grafana Dashboard.

PX-Monitor and PX-Central can simplify management, monitoring, and metadata services for one or more Portworx clusters on Red Hat OpenShift. Using this single pane of glass, enterprises can easily manage the state of their hybrid- and multi-cloud Openshift applications with embedded monitoring and metrics directly in the Portworx user interface. Take a look at this demo of Red Hat OpenShift and Portworx monitoring for the Postgres Operator below.

