


As Red Hat OpenShift environments continue to evolve toward unified platforms for both containers and virtual machines (VMs), the operational boundary between storage admins and virtualization admins is disappearing. The Portworx Dynamic Plugin 2.2.0 for Red Hat OpenShift represents a meaningful step in that convergence, bringing storage observability and control directly into the OpenShift console.
This release introduces an enhanced user experience and deeper integrations in the Portworx Cluster Dashboard and the Portworx tab within the VM page in the OpenShift web console. Together, these capabilities streamline Day-2 operations, empower admins and reduce the cognitive overhead of managing stateful workloads across hybrid platforms.
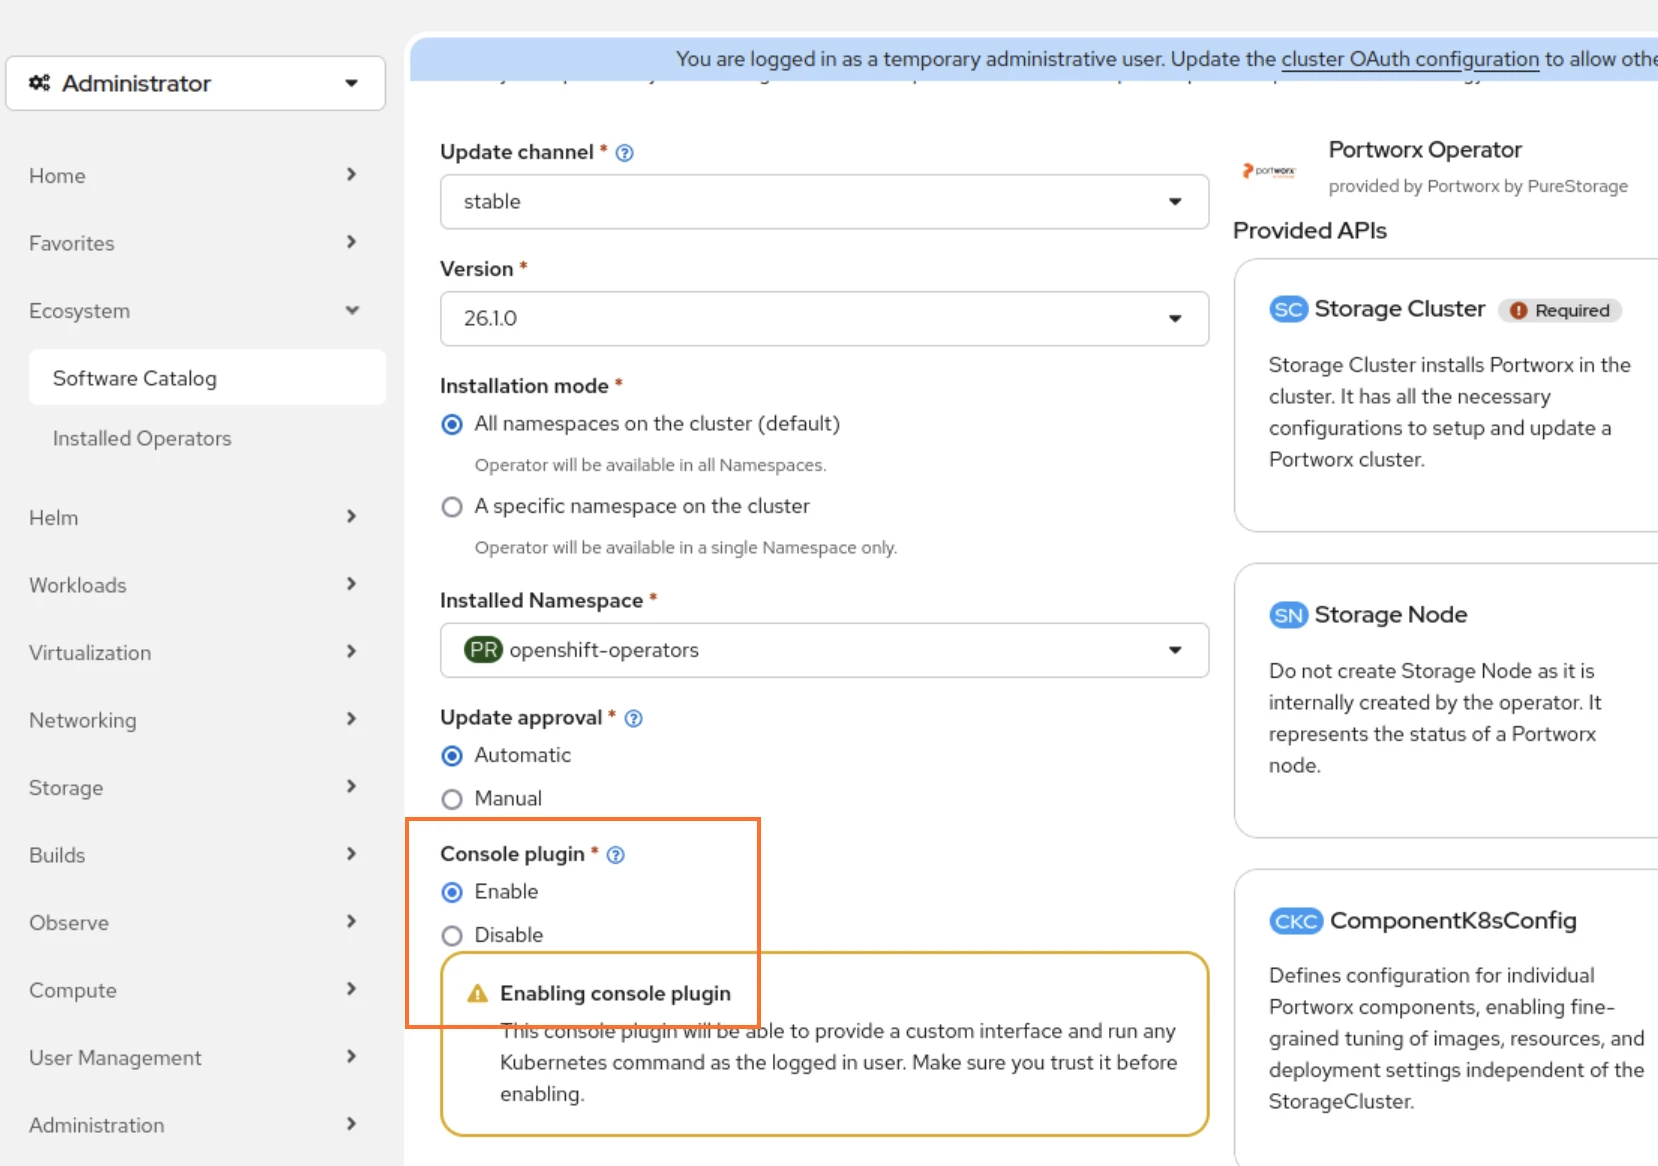
During installation of the Portworx operator, select “Enable” next to the Console plugin radio button. This will make sure that the Portworx operator installs the dynamic plugin. If you forgot this step during initial installation, you can go back and edit the object to enable it.
You must follow the cluster pre-requisites for the plugin to pull metrics properly. This includes enabling OpenShift Prometheus monitoring and creating a cluster-monitoring-config ConfigMap in the openshift-monitoring namespace. For information, see Configure Portworx Monitoring on OpenShift.
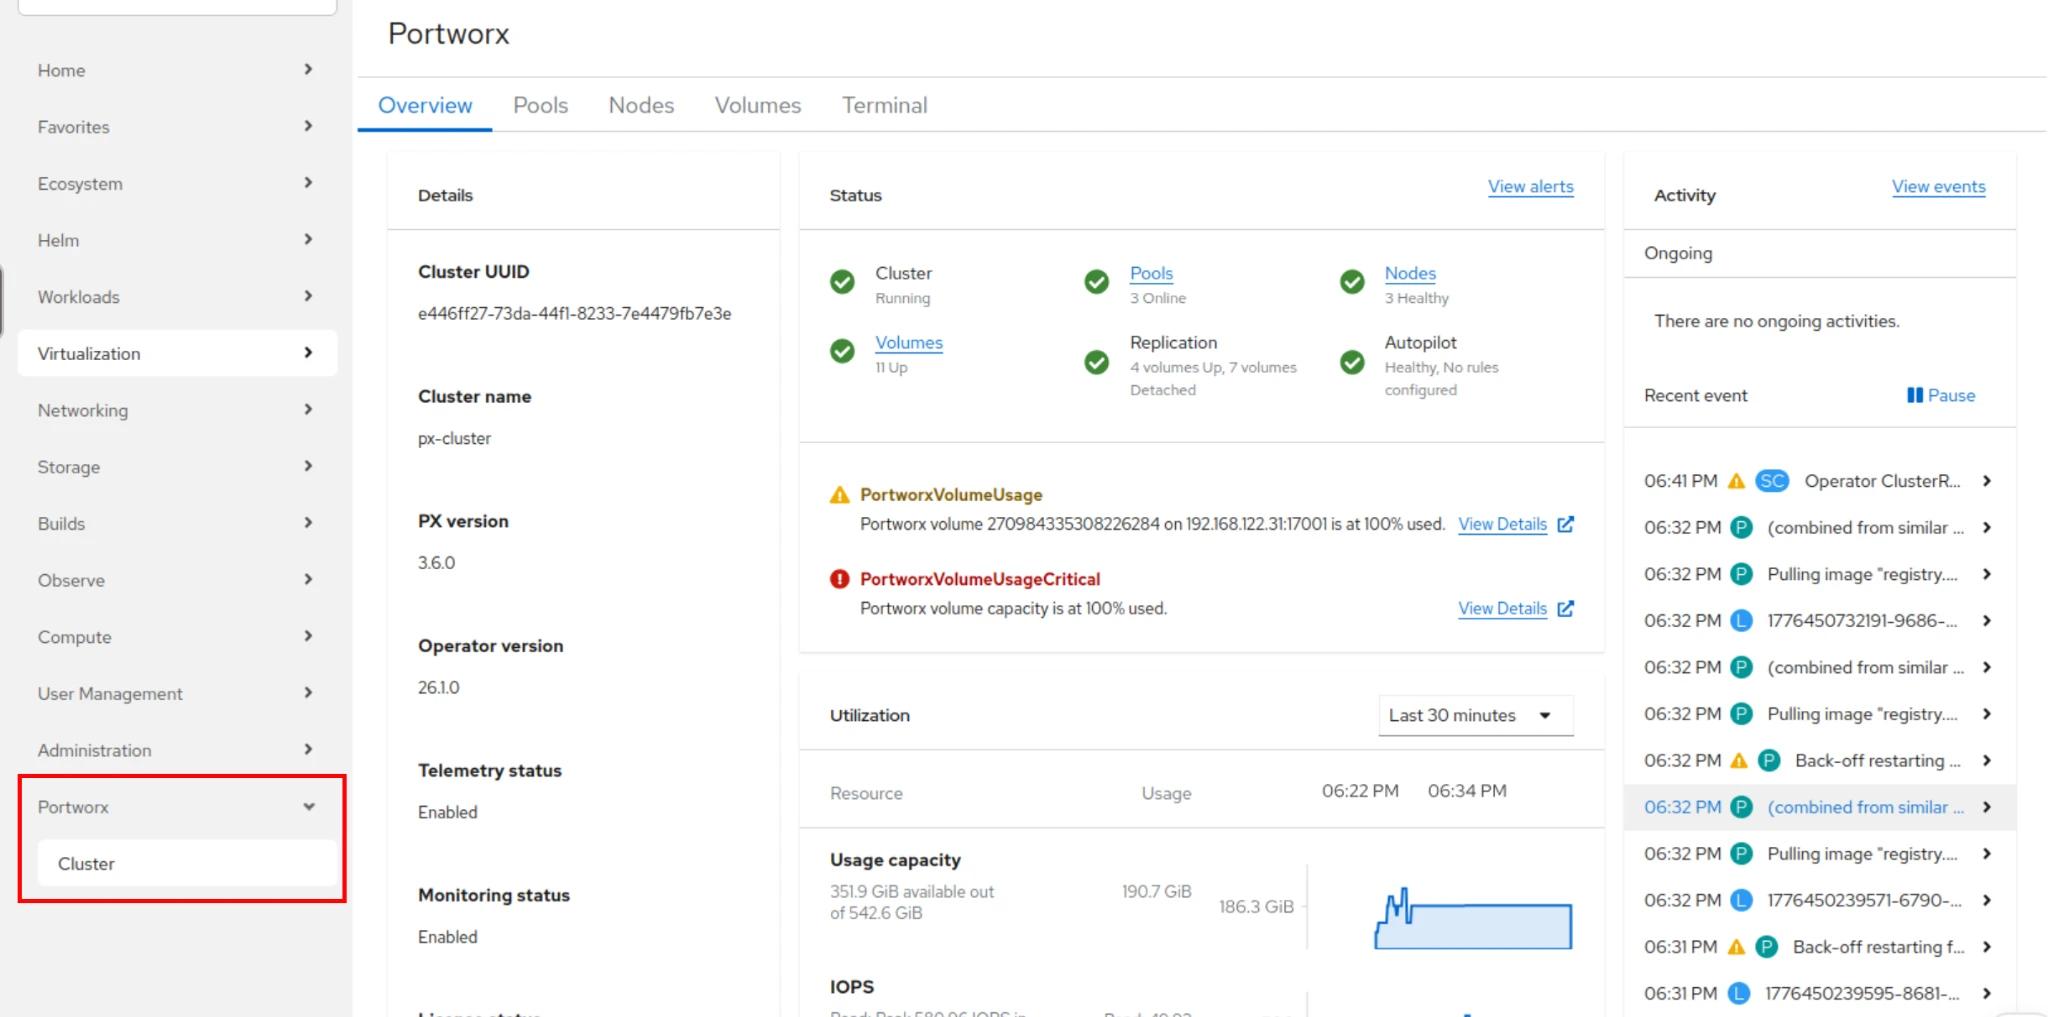
The Portworx Cluster Dashboard provides a consolidated, real-time view of storage health, volume usage, consumption, storage pool observability, overall storage cluster performance and more directly within the OpenShift console.
At a high level, the dashboard enables users to:
One of the most impactful improvements is the ability to move seamlessly from observability to action. Instead of switching to CLI tools or external dashboards, users can:
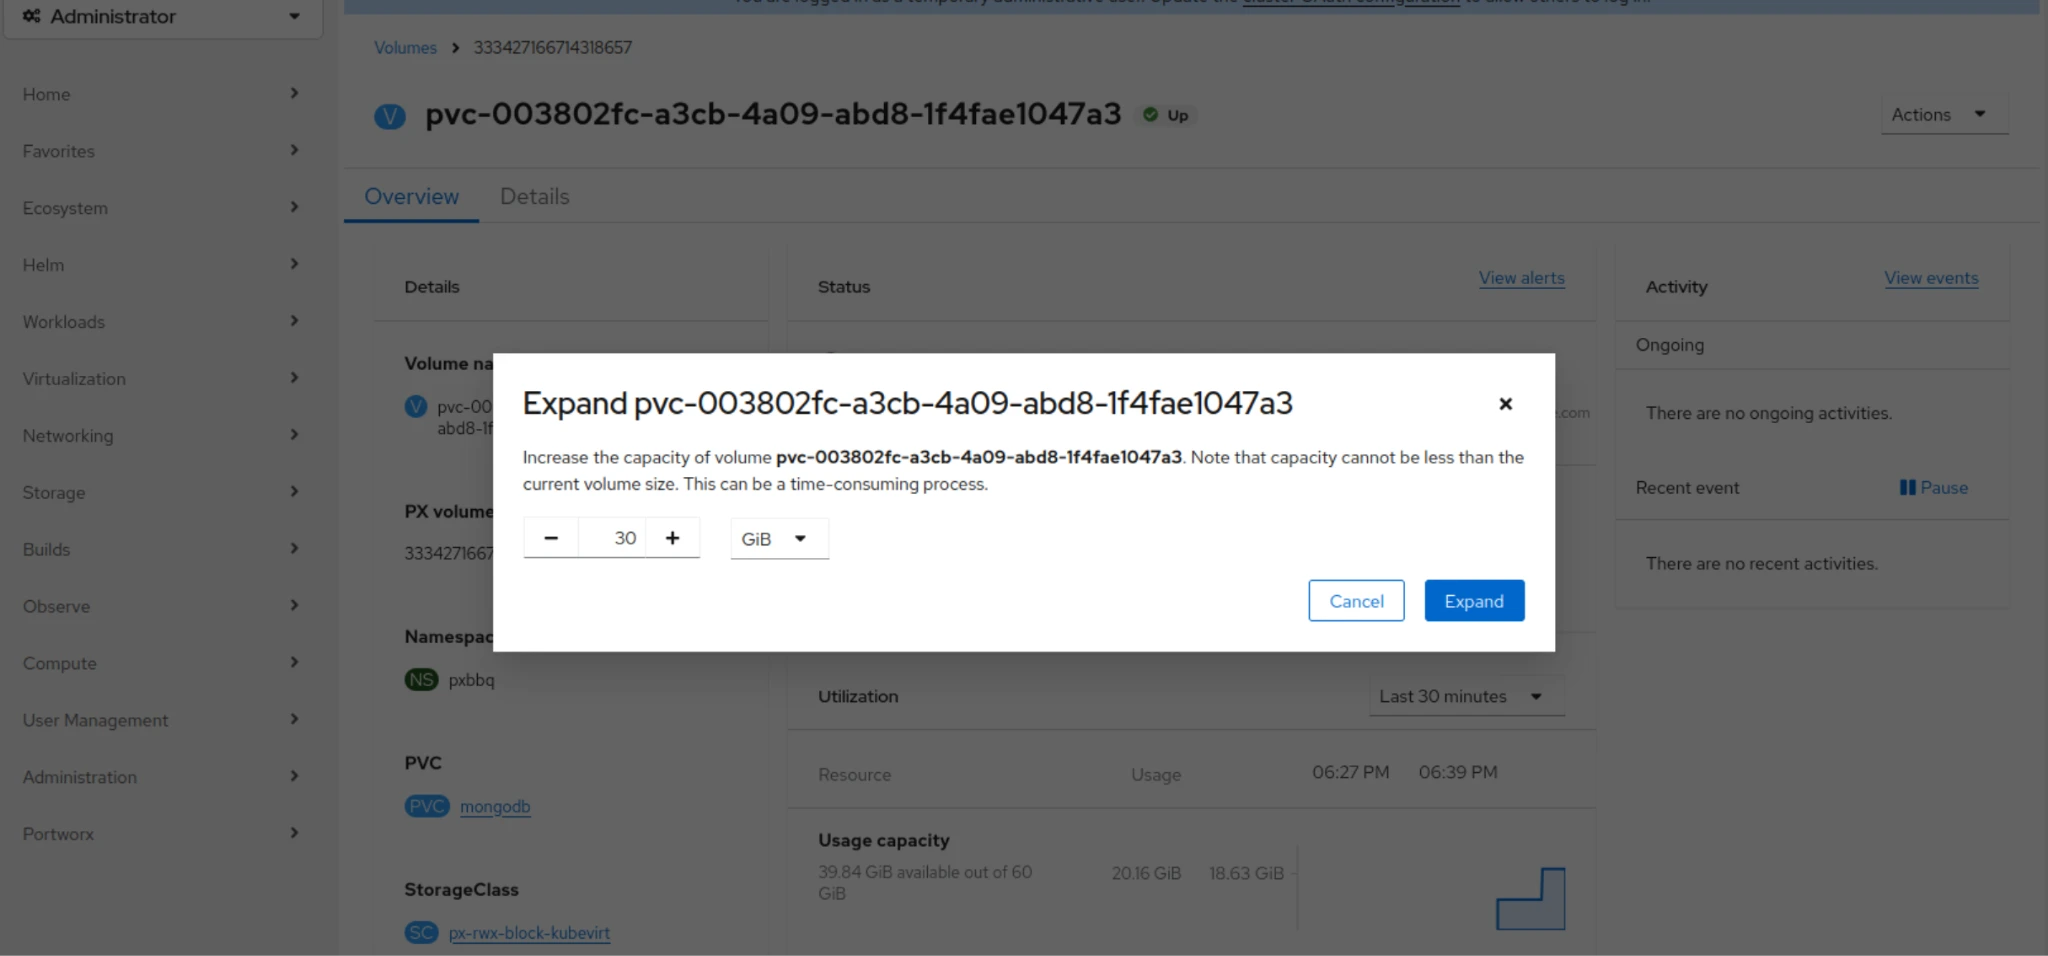
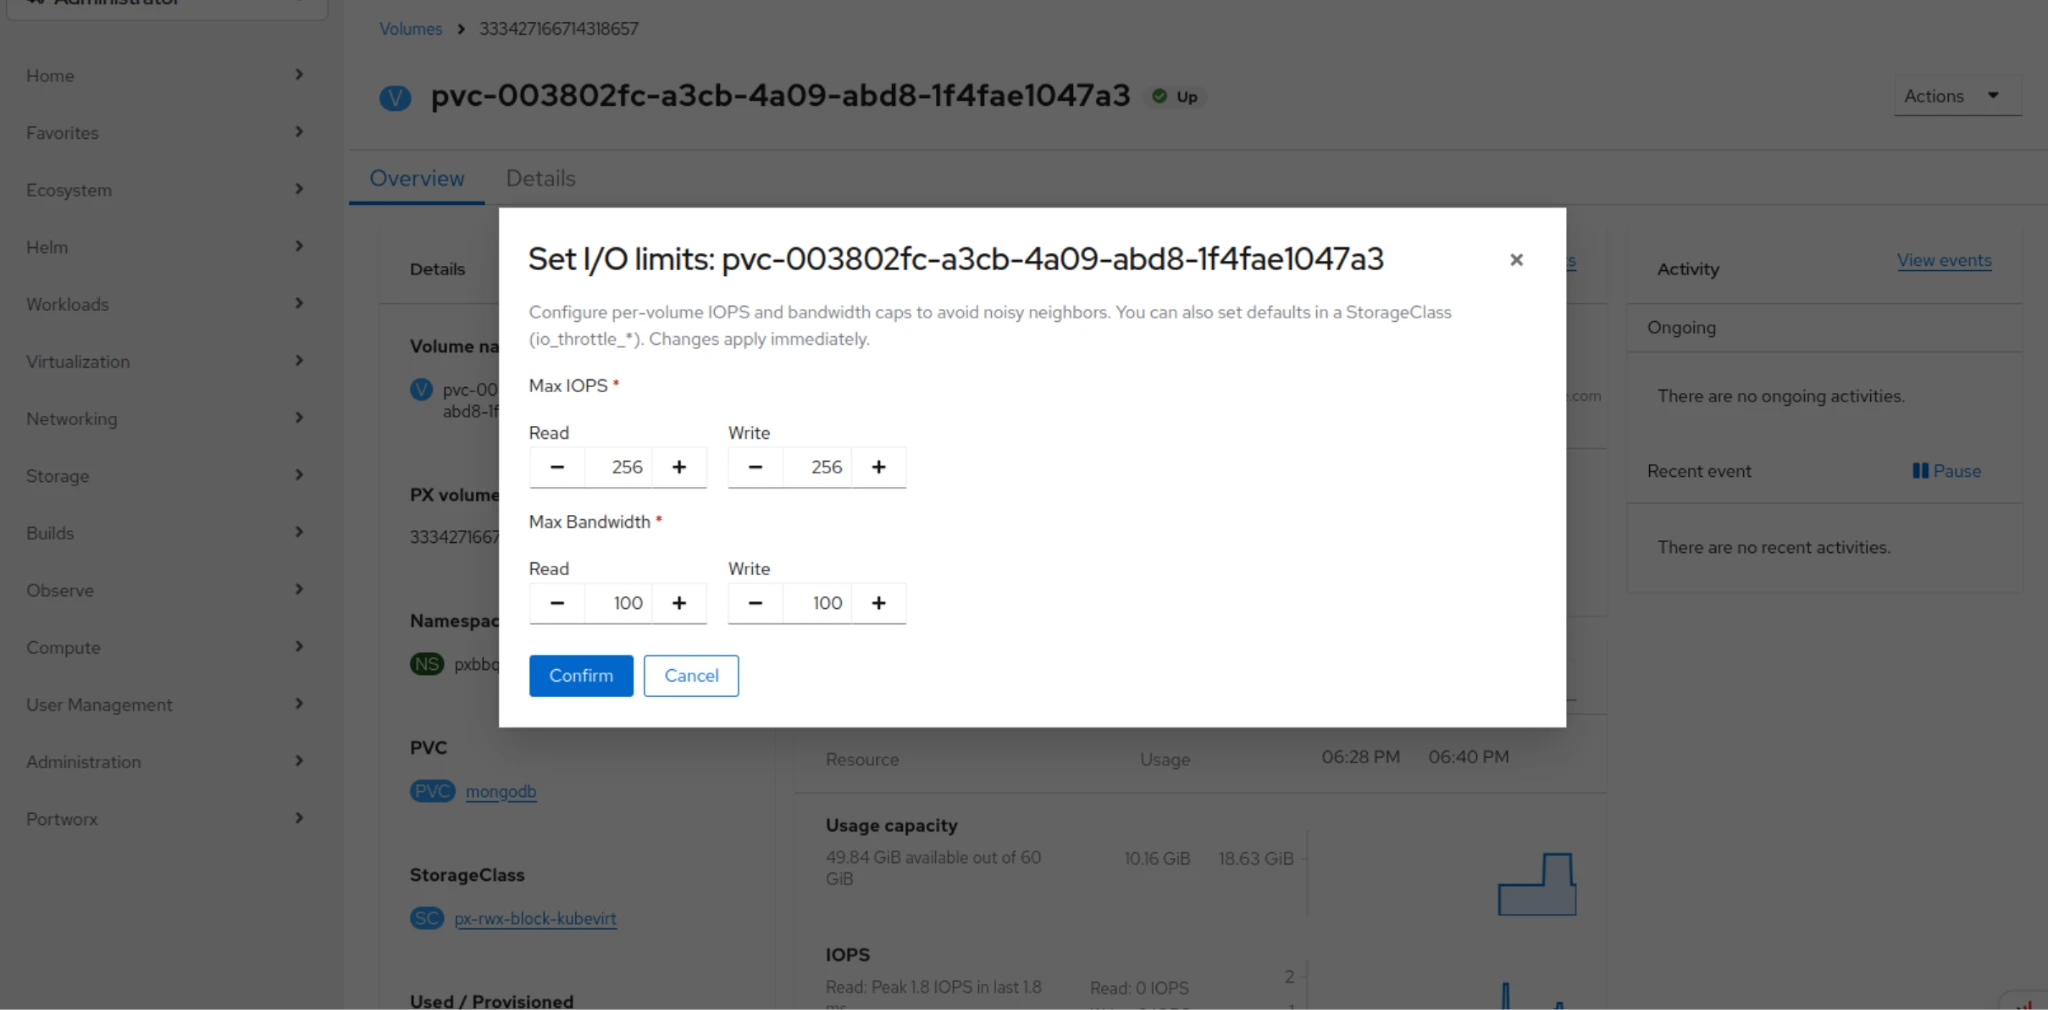
This reduces the operational gap between detection and remediation, a critical factor in production environments where time-to-resolution matters.
The dashboard also improves capacity planning and monitoring by providing visibility across:
This contextual awareness is key. Rather than viewing storage as a flat pool, admins can understand how consumption maps to applications and teams, enabling more accurate forecasting and governance.
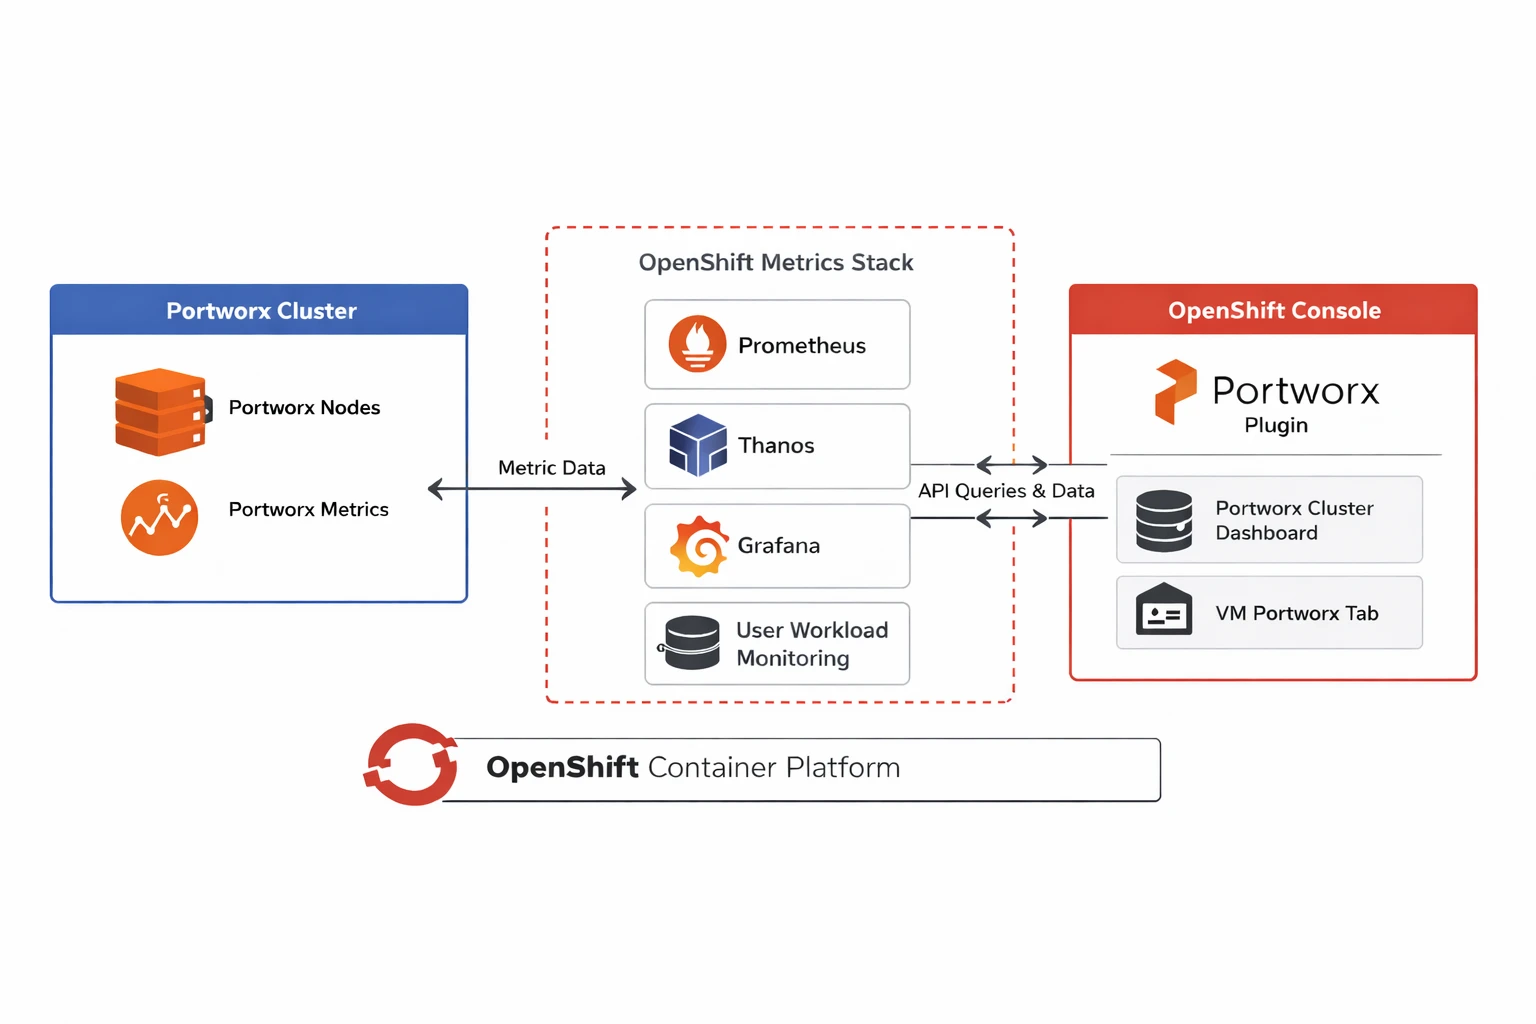
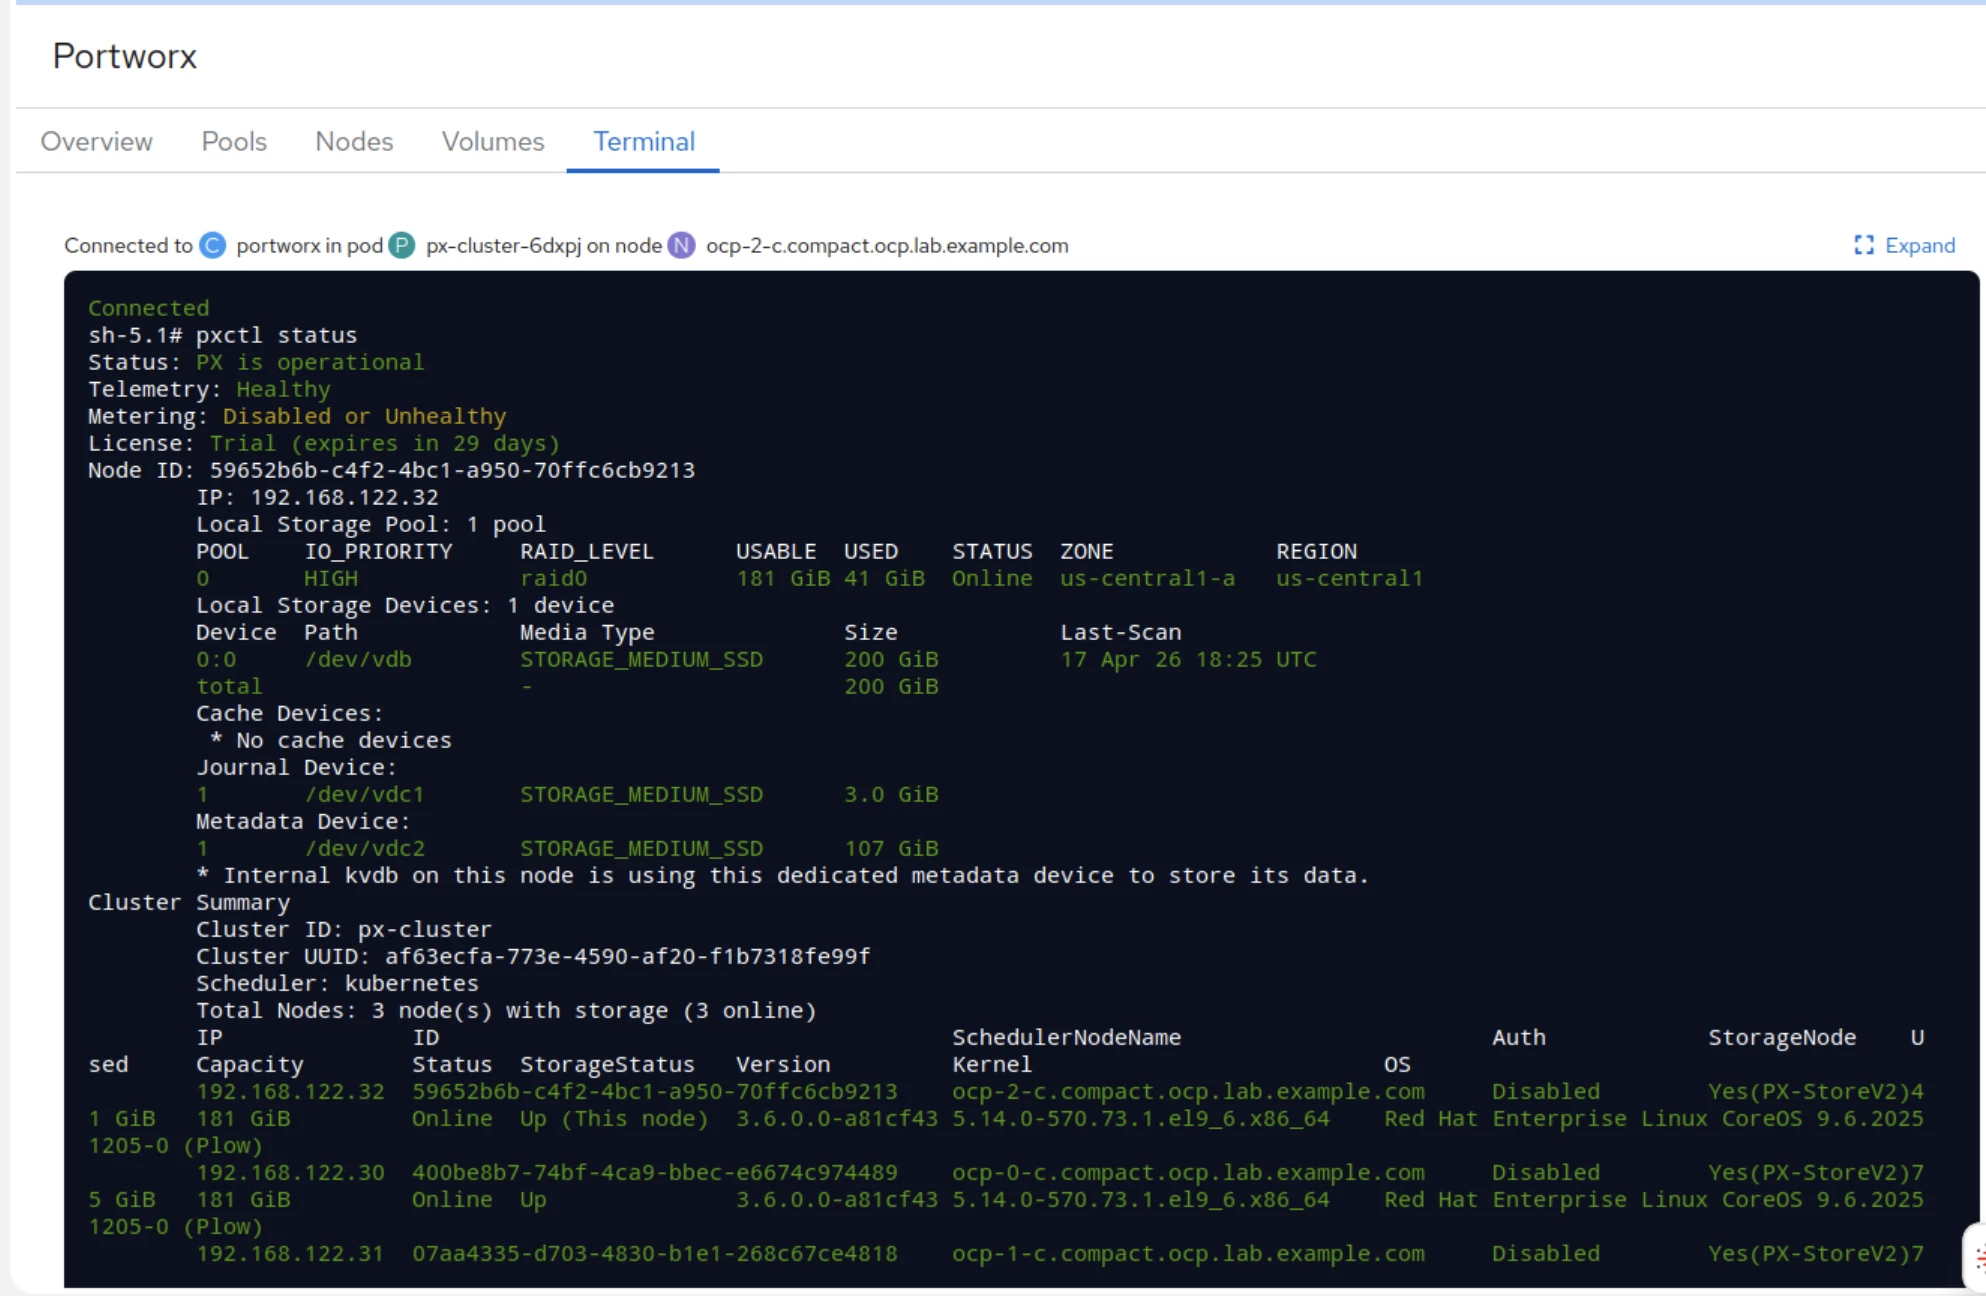
The plugin leverages the OpenShift monitoring stack, allowing it to query metrics from Thanos Querier via sources such as Prometheus and related services directly within the console. This enables responsive, real-time visibility into storage performance without requiring external tooling.
For storage admins, this means faster navigation and more reliable observability, even in high-scale environments.
Demo
While the Cluster Dashboard enhances storage-centric workflows, the Portworx tab on the KubeVirt VirtualMachine page brings storage visibility directly into individual VM operations.
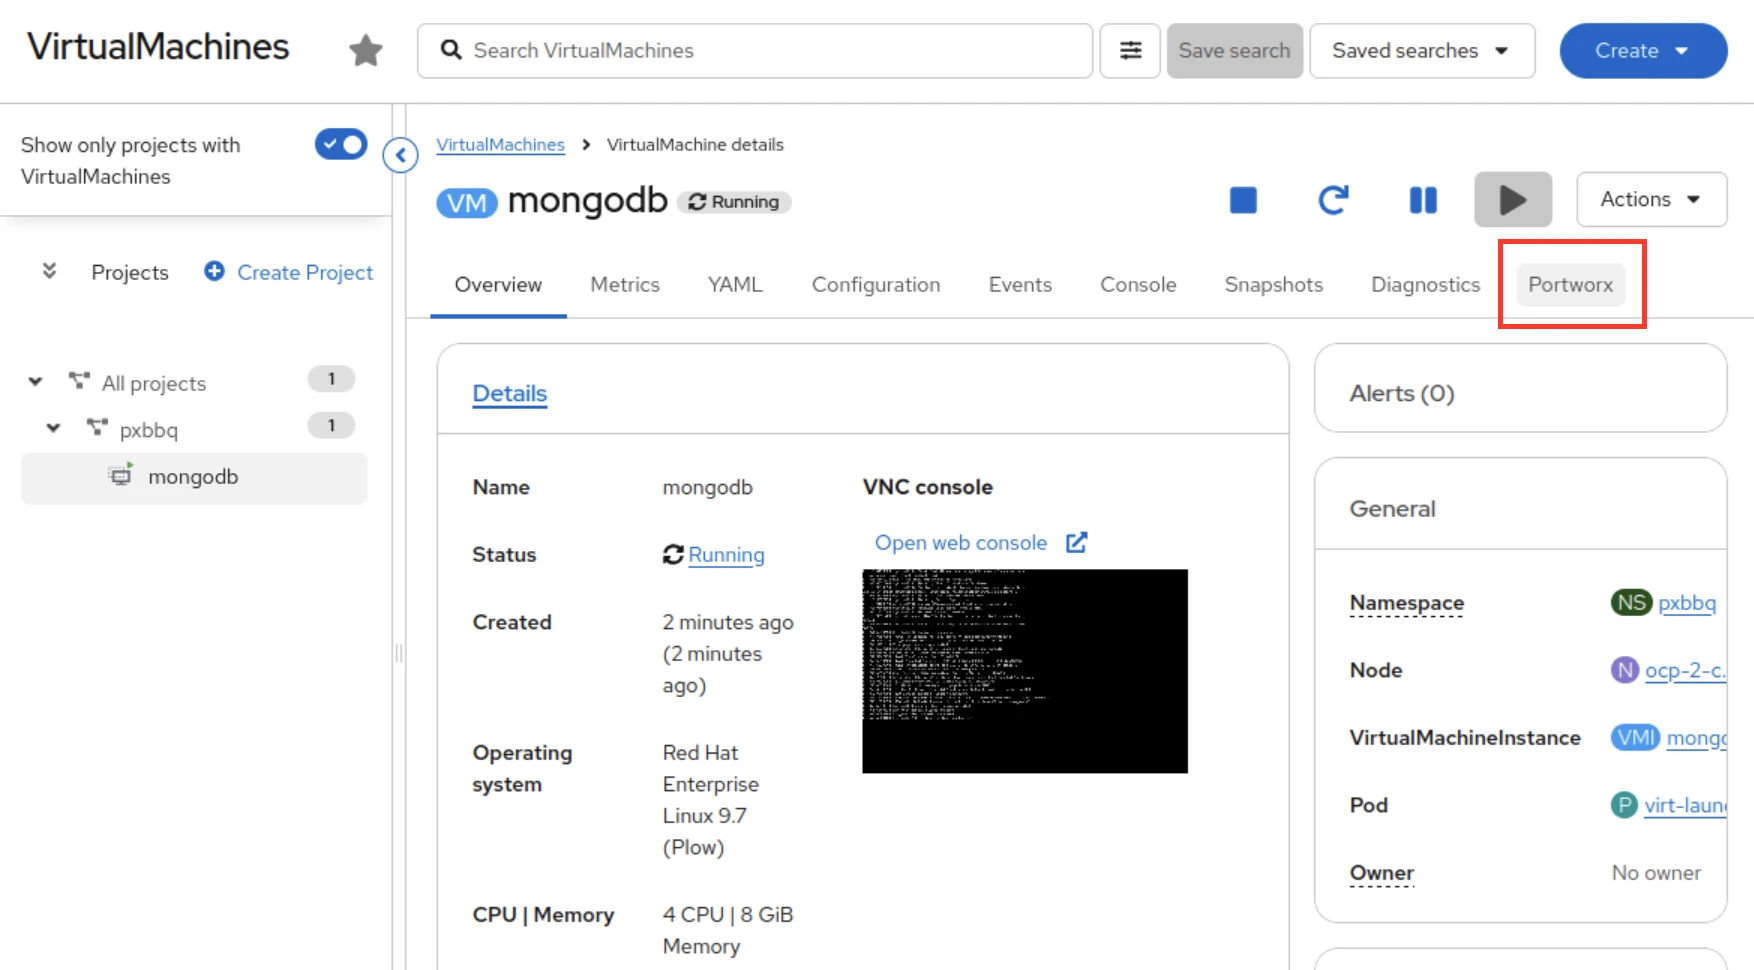
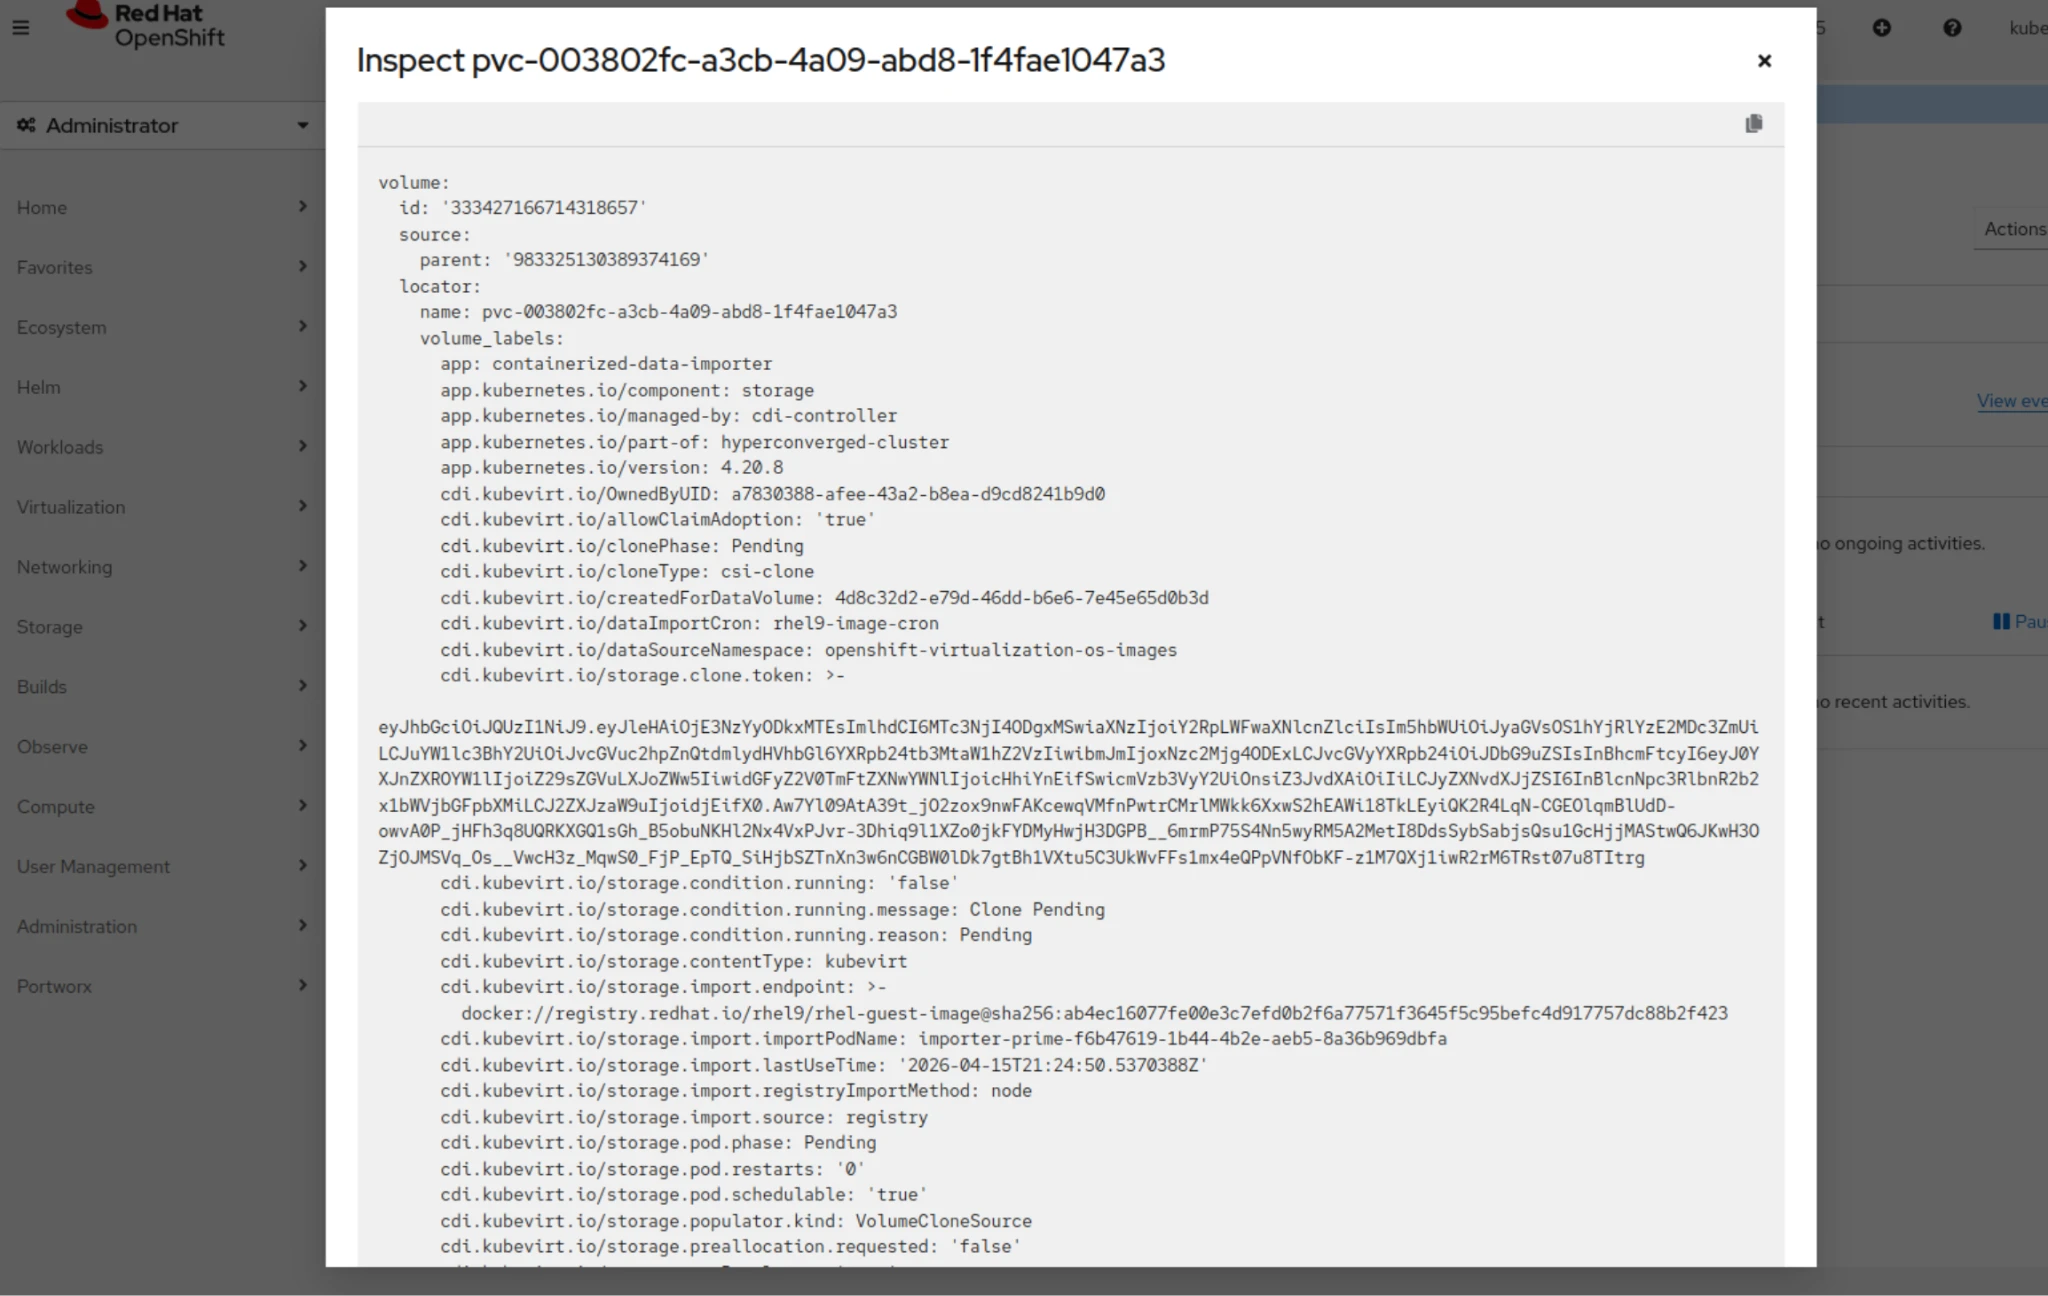
When the plugin is enabled, a dedicated Portworx tab appears within each VirtualMachine resource, allowing users to:
This feature fundamentally changes how VM admins interact with storage within OpenShift. It brings storage and data management directly into the Red Hat OpenShift console with a familiar graphical user interface designed for both beginner and advanced teams adopting Kubernetes. VM admins can drill into per-VM disk performance and execute volume operations — all without leaving the console or requiring CLI expertise, while giving platform teams more granular visibility into storage health across their environment.
In a Kubernetes architecture, previously, a VM admin encountering a disk issue would need to do the following from the CLI:
Now, that entire workflow is embedded directly within the VM context in the UI.
Demo
Portworx Dynamic Plugin 2.2 for Red Hat OpenShift is not just a UI enhancement, it’s a shift toward platform-level convergence and familiar operating models for storage and VM admins.
For storage admins, it means:
For VM admins, it means:
For platform teams, it means:
As organizations increasingly run mixed workloads, with containers alongside VMs, operational boundaries must evolve. Portworx Dynamic Plugin 2.2 for Red Hat OpenShift addresses this need by embedding storage visibility and control directly into the Red Hat OpenShift console, giving VM admins and platform teams a familiar, GUI-driven experience rather than forcing them to the CLI. The combination of a powerful Cluster Dashboard and VM-level storage visibility creates a shared language between teams. This is where storage stops being “someone else’s problem” and becomes a first-class part of the application platform.