Organizations have key business objectives such as better customer self-service, higher revenue targets or other business considerations as they grow their business. Technology selection, like microservice adoption or container orchestrator selection, has to support these key business outcomes. Organizations expect their container platforms which may run revenue generating applications to perform in a reliable and consistent manner. The Portworx data platform, Portworx Enterprise, plays a critical role in running stateful applications on container orchestrator like Kubernetes.
The reliability of the container platform and its subsystems should be observable and must generate monitoring data in order to track progress towards the business outcome. In this blog post, we will look at Portworx Enterprise’s observability via generated metrics and look at the included dashboards that can help you observe the reliability and performance of your application.
Observability of a platform
For a cloud native data solution like Portworx, with its scalability, security and API-driven nature, observability is a non-negotiable requirement. Let’s look at the key components of what makes an observable platform:
- Alerting
- The platform should offer alerting capabilities so that the platform owner can be informed if the platform is not working reliably. Alerts typically contain brief information about the problem-state of the platform and when the platform went into the alert state.
- Logging
- Platform logs help you with details needed to troubleshoot the system and help you perform a Root Cause Analysis(RCA). Logs help you capture state or event changes within the system for debugging a distributed system. Logs help you audit events in a multi-tenant system for legal and compliance reasons.
- Monitoring
- Monitoring systems can be based on metrics or logs. Metrics typically measure and or quantify platform information as a number. You can use the metrics number to set up threshold conditions for when to alert the platform owner. Metrics can help you do analysis such as correlation, trend or anomaly detection.
Portworx Observability
Portworx provides cloud native storage and data management for applications running on Kubernetes. If your stateful Kubernetes applications, backed by Portworx Enterprise, are generating revenue, you want to ensure your data platform is running reliably and is observable so that you are able to take corrective action quickly. Portworx Enterprise observability is achieved by:
- Alerting
- The Portworx platform includes a built-in alert-manager. You can find more information about Portworx alerts here
- Logging
- The Portworx platform logs system, security audit logs. You can learn about how to integrate Portworx logs with Kubernetes here
- Monitoring
- The Portworx data platform uses Prometheus to expose platform metrics. You can learn about the Prometheus integration here
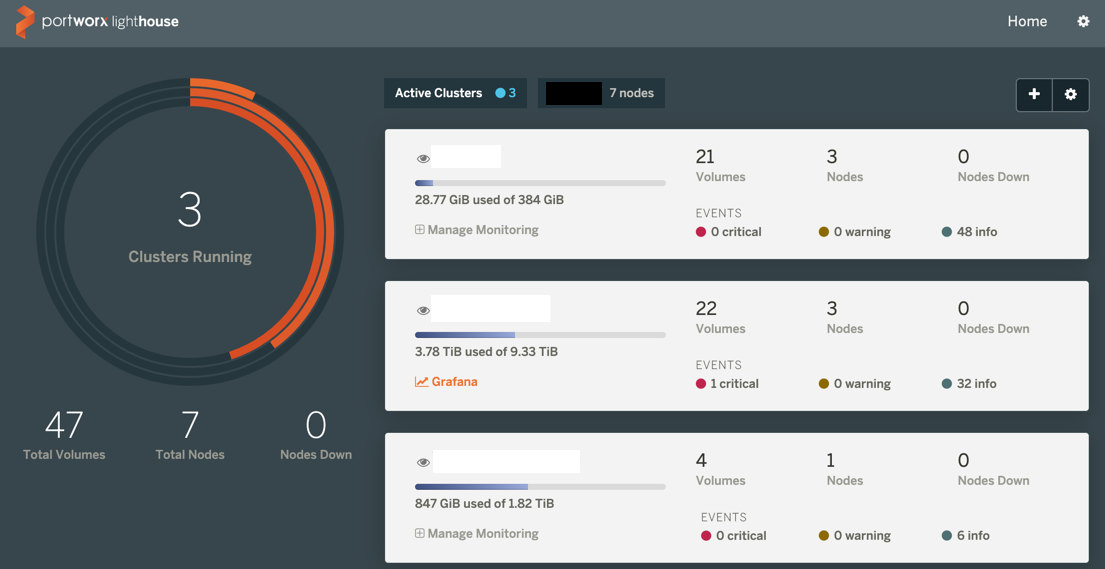
- Visualization
- The Portworx platform includes a great UI to visualize and inspect your data and also includes pre-built Grafana dashboards
Dashboards for Data Platform
What are SLO, SLA, SLIs?
As the Kubernetes platform owner, you want to achieve a business reliability target, typically known as service level objective (SLO) and create a service level agreement (SLA) between the platform team and the customer – the developers on the platform. We can further break down SLOs into key quantitative measures called Service Level Indicators (SLIs) such as availability, response time, frequency, error-rates, saturation rates, and others.
Portworx data platform comes pre-built with Grafana dashboards to help you track your SLAs and business objectives. You can find the Portworx cluster dashboard Grafana template here and the Portworx Volume dashboard Grafana template here. Using the Portworx data dashboards, you can observe the RED metrics of the data platform:
- Rates and Throughputs of Reads/Writes
- Error rates and volume IO queue depth
- Duration and or distribution of activity across the data cluster
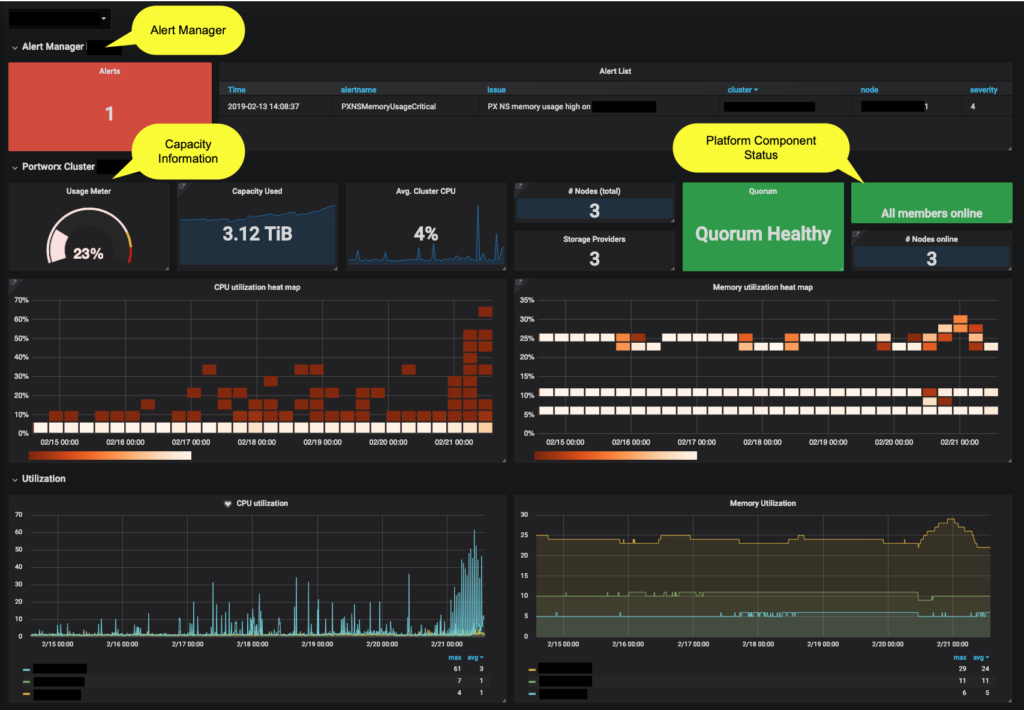
In the Portworx cluster dashboard image above, we wanted to highlight
- Built-in alert manager so that you can investigate proper functionality of the platform
- Platform component status – Shows the health status & stability of internal components
- Capacity-planning – Helps platform owners look at resource utilization & plan expansion.
- System metrics like CPU and memory utilization to help you manage your cluster fleet.
Where do we go from here?
Visualization of your platform’s metrics is a great step towards understanding, observability and efficient operation of your platform. On your dashboards, make a conscious decision about sections & metrics which will act as “information-emitters” versus sections and metrics which will be actionable. Mixing information-emitters with actionable metrics and not setting proper alerting thresholds can lead to “alert-fatigue”. Finally, make sure your dashboards flow up to the business outcomes the organization is trying to achieve (uninterrupted revenue generation from your Kubernetes applications).
Once you emit and collect data from your platform components, you are in a position to introduce a rule-based decision engine and or develop an AI/ML-based solution engine to automate routine tasks like adding capacity to your platform.
If you have questions about how Portworx Enterprise can help your organization with data protection and data portability when running on cloud native container orchestrators, please reach out to one of our Portworx experts and request a demo.
Share
Subscribe for Updates
About Us
Portworx is the leader in cloud native storage for containers.
Thanks for subscribing!

Vick Kelkar
Vick is Director of Product at PortworxWith over 15 years in the technology and software industry, Vick’s focus is on developing new data infrastructure products for platforms like Kubernetes, Docker, PCF, and PKS.
Explore Related Content:
- dashboard
- Grafana
- Lighthouse
- monitoring
- Prometheus