Product Announcements
Introducing Operations Center in Portworx – Beyond Monitoring to Actionable Storage Insights


Summarize Blog With
Table of Content
Modern Kubernetes environments generate extensive operational telemetry. Portworx provides detailed information about storage health, performance, and availability, while tools such as Prometheus and Grafana help administrators monitor metrics, visualize trends, and detect issues.
However, when a volume loses quorum, a storage node becomes unhealthy, or a storage pool approaches capacity limits, understanding the impact often requires switching between multiple tools. Administrators may use pxctl to examine cluster health, kubectl to inspect Kubernetes resources, and Grafana to analyze performance metrics, manually correlating information to identify affected resources and workloads.
The challenge isn’t a lack of monitoring data. It’s turning that data into actionable insights.
Operations Center by Portworx addresses this challenge by bringing together cluster health, alerts, infrastructure relationships, performance metrics, and diagnostics into a unified experience. By connecting storage infrastructure with workloads and virtual machines, it helps administrators move from identifying symptoms to understanding their potential impact on applications. This visibility enables administrators to identify affected resources, investigate potential storage bottlenecks, distinguish storage-related issues from problems elsewhere in the application stack, and determine where to begin troubleshooting.
What Is Operations Center by Portworx?
Operations Center is an integrated, storage-aware observability solution designed to simplify Day-2 operations for Portworx Enterprise.
Unlike traditional monitoring workflows that often present metrics and alerts separately from infrastructure context, Operations Center connects monitoring information with storage resources and workloads across three key dimensions:
Health: Provides unified visibility into storage nodes, pools, volumes, and virtual machines. By connecting storage health information with infrastructure and workload relationships, Operations Center helps administrators understand how storage issues may affect applications, identify impacted resources, and determine where to begin their investigation.
Performance: Offers contextual performance metrics and historical trends, including latency, IOPS, throughput, and capacity utilization. For example, Source Disk latency metrics help administrators investigate potential storage bottlenecks, while VM-level storage visibility helps determine whether performance issues are associated with Portworx storage or require investigation elsewhere in the application stack.
Availability and Impact: Uses blast-radius information and interactive topology to show relationships between storage resources and workloads, helping administrators assess the potential impact of an issue.
By combining these capabilities, Operations Center goes beyond detecting storage issues to helping administrators understand what is affected and where to investigate next.
How Operations Center Fits into Your Kubernetes Environment
Operations Center integrates with existing Kubernetes environments, combining storage infrastructure information, Kubernetes resource context, and performance telemetry through an in-cluster architecture.
The architecture brings together three key components:
- Operations Center UI: Provides a unified interface for viewing cluster health, investigating alerts, exploring storage relationships, analyzing performance metrics, and accessing diagnostic information.
- PX Cache Agent: Aggregates information from Portworx and Kubernetes resources and retrieves performance metrics from the configured monitoring infrastructure, making this information available to the Operations Center UI.
- Prometheus / Thanos Querier: Provides access to performance metrics through the existing monitoring infrastructure. On OpenShift, the platform’s Thanos Querier can serve as the metrics endpoint.
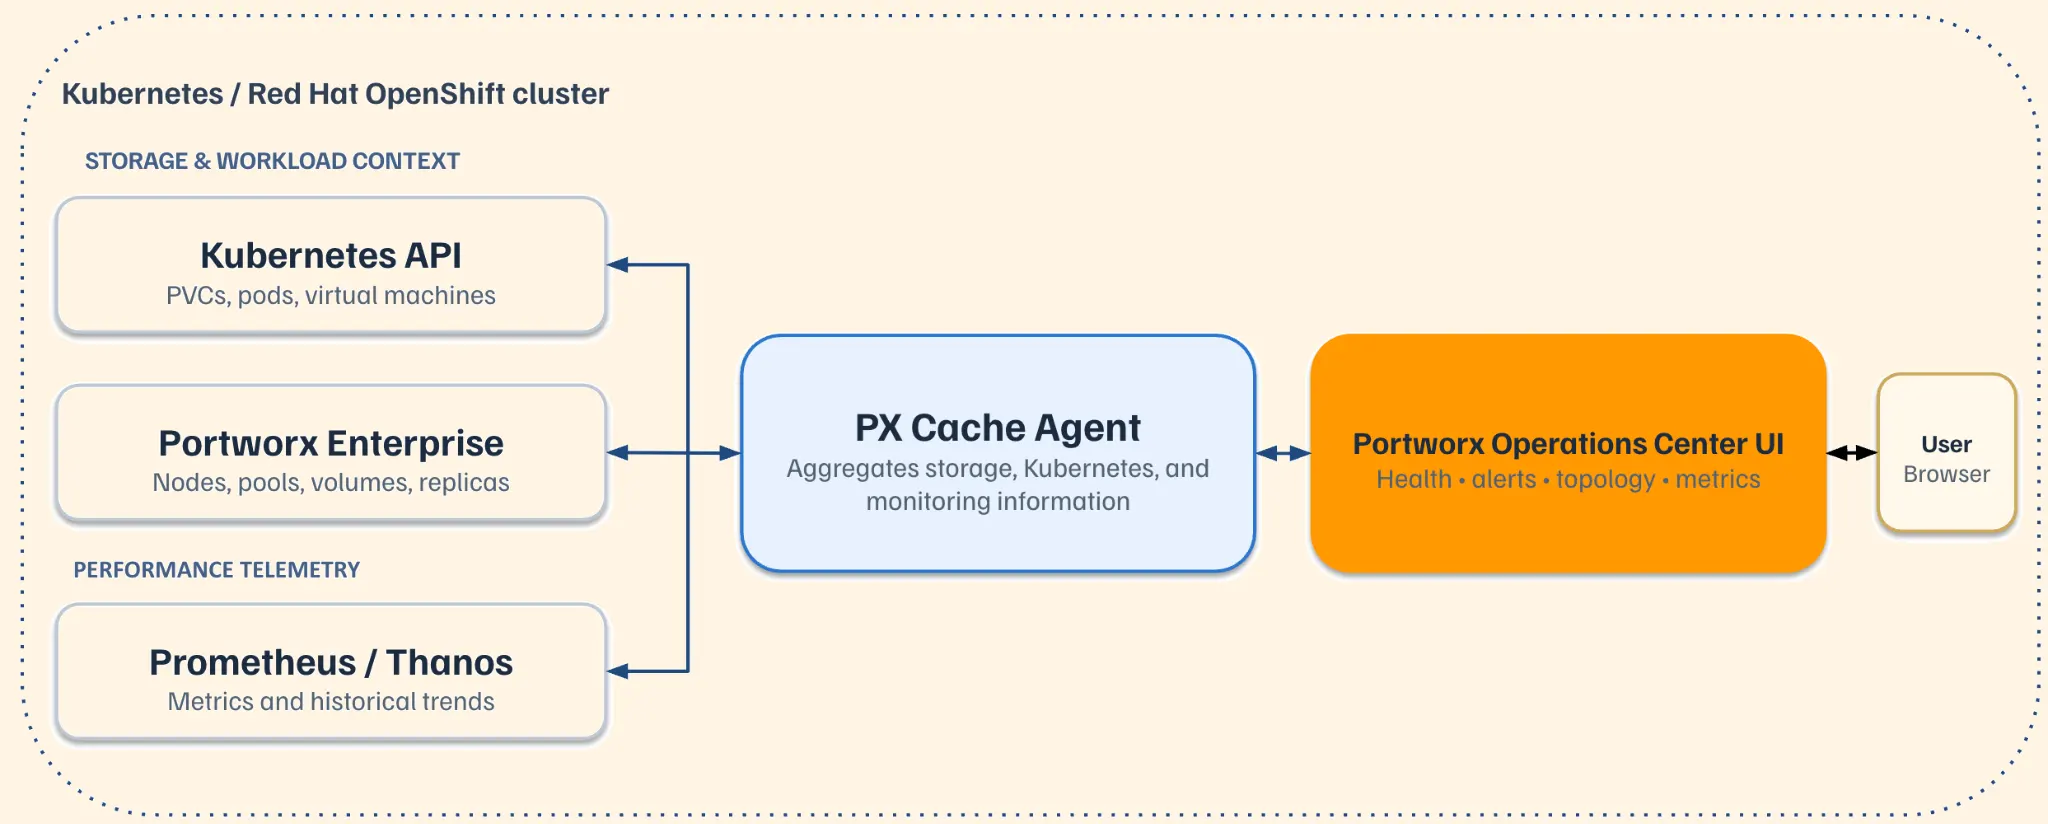
By leveraging existing Kubernetes, Portworx Enterprise, and monitoring infrastructure, Operations Center provides storage-aware operational insights without requiring a separate cloud-hosted observability platform. Its in-cluster architecture also makes it suitable for environments where maintaining control over operational data and minimizing external dependencies are important.
Getting Started with Operations Center
Getting started with Operations Center is straightforward for environments already running Portworx Enterprise on Kubernetes or Red Hat OpenShift. The solution is deployed using Helm and integrates with existing Portworx components and Prometheus-based monitoring infrastructure.
Before deployment, administrators should ensure that the required Portworx Enterprise version and monitoring prerequisites are met. Configuration varies slightly between Kubernetes and OpenShift, particularly in how the PX Cache Agent is deployed and how Prometheus metrics are accessed.
Once configured, administrators can access the Operations Center interface to explore cluster health, investigate issues, visualize storage relationships, and analyze performance metrics.
For supported versions, prerequisites, and step-by-step deployment instructions, refer to the official Operations Center documentation.
Exploring Operations Center
Once Operations Center is deployed, administrators can access its web-based interface to gain a consolidated view of storage health, performance, and operational issues across their Kubernetes or OpenShift environment.
The interface brings together cluster information, issue triage, infrastructure topology, storage resource visibility, performance metrics, and diagnostic capabilities, helping administrators investigate storage issues from a single location.
Unified Cluster Health and Issue Triage
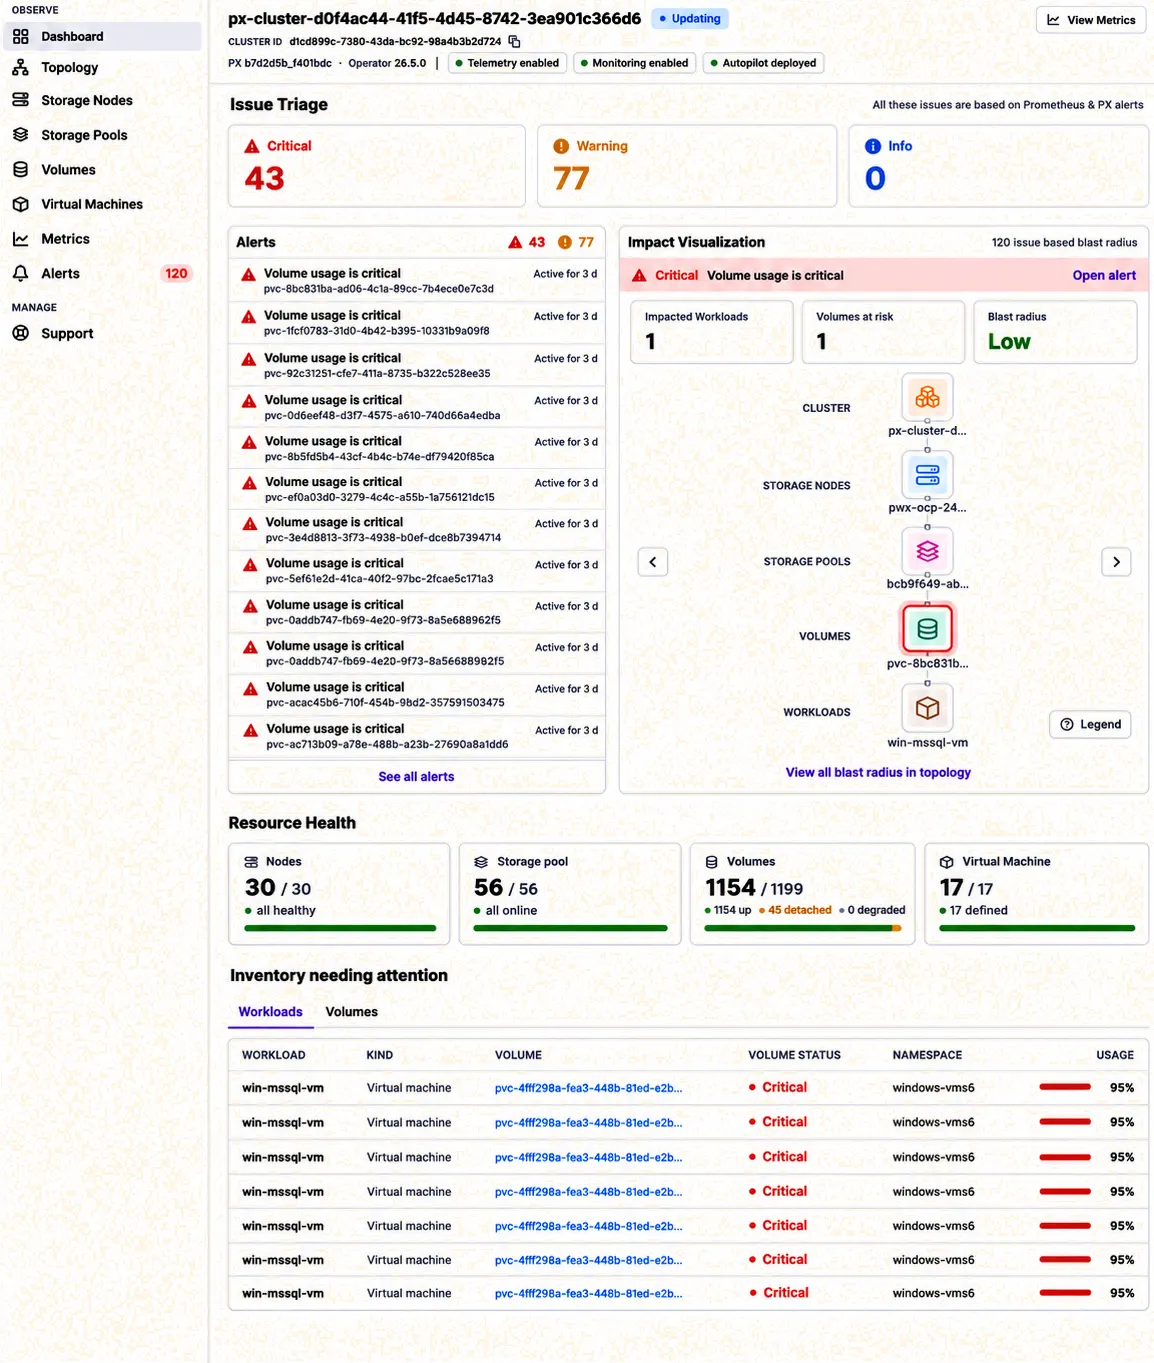
The Operations Center dashboard serves as the starting point for understanding overall cluster health and identifying issues that require attention.
It provides a consolidated view of Portworx cluster status, version information, and the operational state of services such as Telemetry, Monitoring, and Autopilot.
Beyond cluster status, Issue Triage brings together critical, warning, and informational issues derived from Prometheus and Portworx alerts, helping administrators identify conditions that may affect storage health and availability. These severity levels are based on predefined Prometheus alerting rules and Portworx alert definitions, rather than being independently determined by Operations Center.
Impact Visualization adds another layer of context by highlighting impacted workloads, volumes at risk, and the potential blast radius of an issue. It also illustrates relationships between the affected storage resources, helping administrators understand how an issue may extend from infrastructure components to workloads.
For example, a critical volume-capacity alert may affect a single workload, while a storage node issue could potentially impact multiple volumes and applications. Understanding this distinction helps administrators assess the scope of an issue and prioritize their investigations.
By combining cluster health, issue triage, and impact visualization, Operations Center helps administrators move beyond individual alerts to understanding their operational significance.
From Alerts to Insights: Understanding Storage Dependencies
A single storage infrastructure issue can trigger multiple alerts across different components. For example, when a storage node becomes unavailable, administrators may receive alerts related to storage pool availability, degraded volumes, or replica health. While these alerts indicate potential problems, understanding how they are connected and which workloads may be affected often requires additional investigation.
Operations Center simplifies this process by connecting alerts with their associated storage resources, allowing administrators to investigate issues in the context of the affected infrastructure rather than examining individual alerts in isolation.
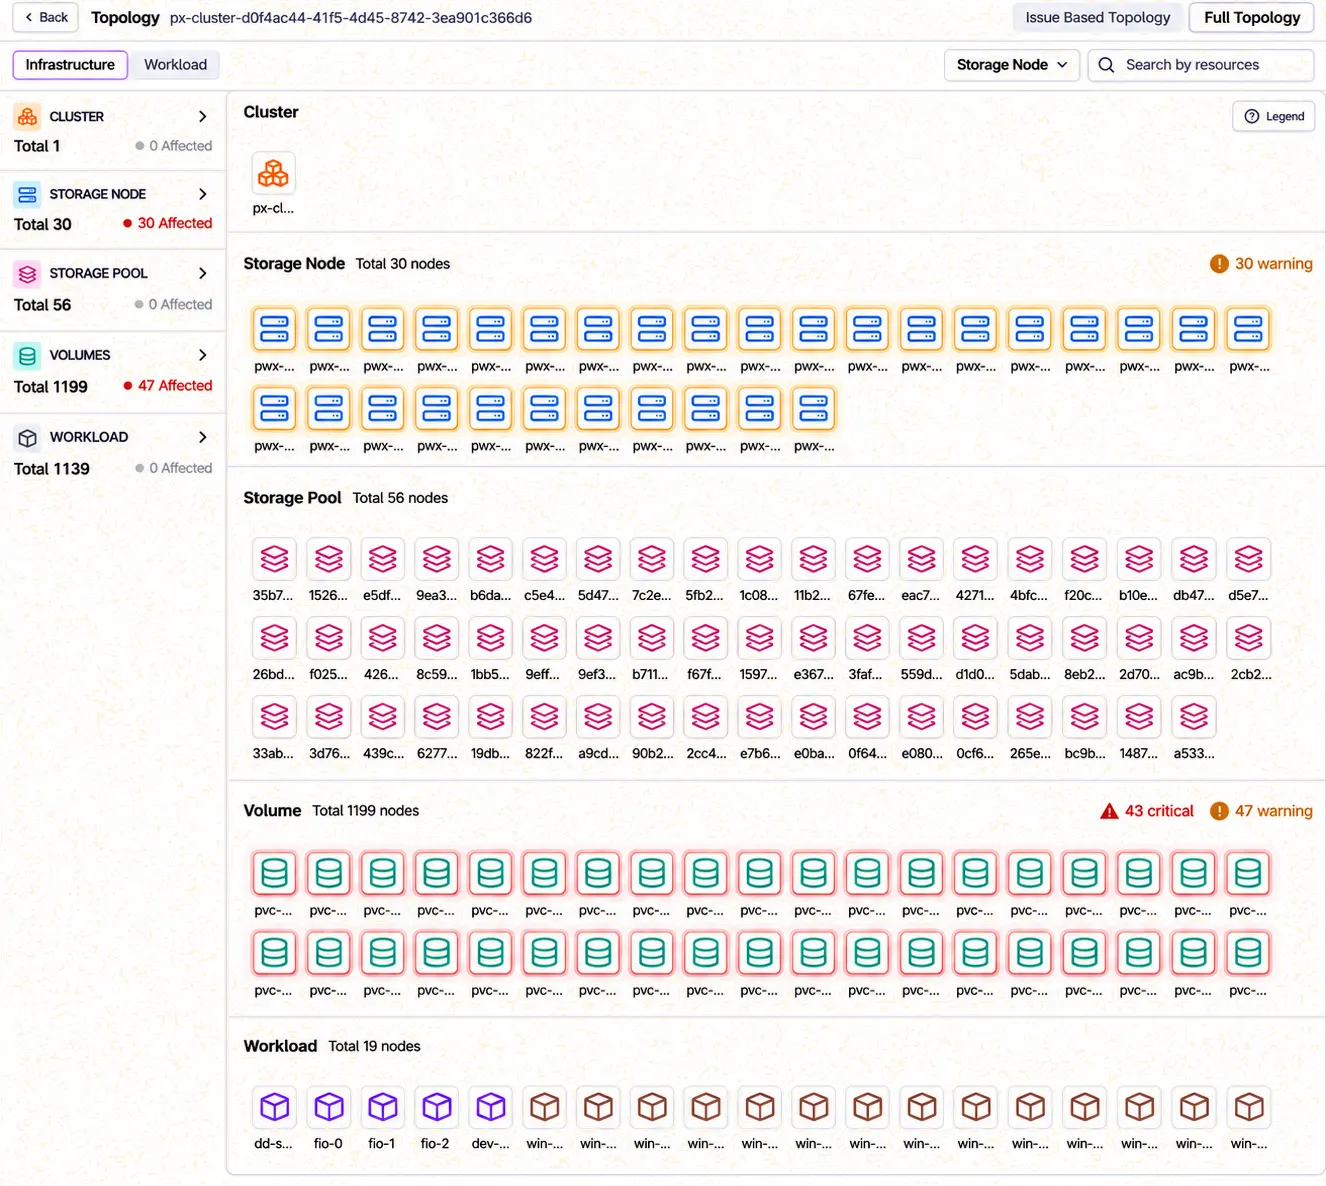
Interactive Topology provides a visual representation of the relationships between Portworx storage resources and Kubernetes workloads, helping administrators understand infrastructure dependencies and assess the potential impact of an issue.
Two topology perspectives support different operational needs:
- Issue-Based Topology: Focuses on resources associated with a specific issue, illustrating relationships across the cluster, storage nodes, pools, volumes, and workloads. This helps administrators understand the scope of an issue and identify potentially affected resources.
- Full Cluster Topology: Provides a broader view of storage infrastructure and workload relationships across the cluster, helping administrators explore resource dependencies and understand how storage components are connected.
For example, when investigating a degraded volume, administrators can use topology to examine its relationship with the underlying storage infrastructure and the workload consuming it.
Unified Visibility Across Storage Resources and Virtual Machines
Understanding the health of a Kubernetes storage environment requires visibility beyond the overall cluster status. Administrators need to examine individual storage resources, identify unhealthy components, and understand how infrastructure conditions may affect applications and virtual machines.
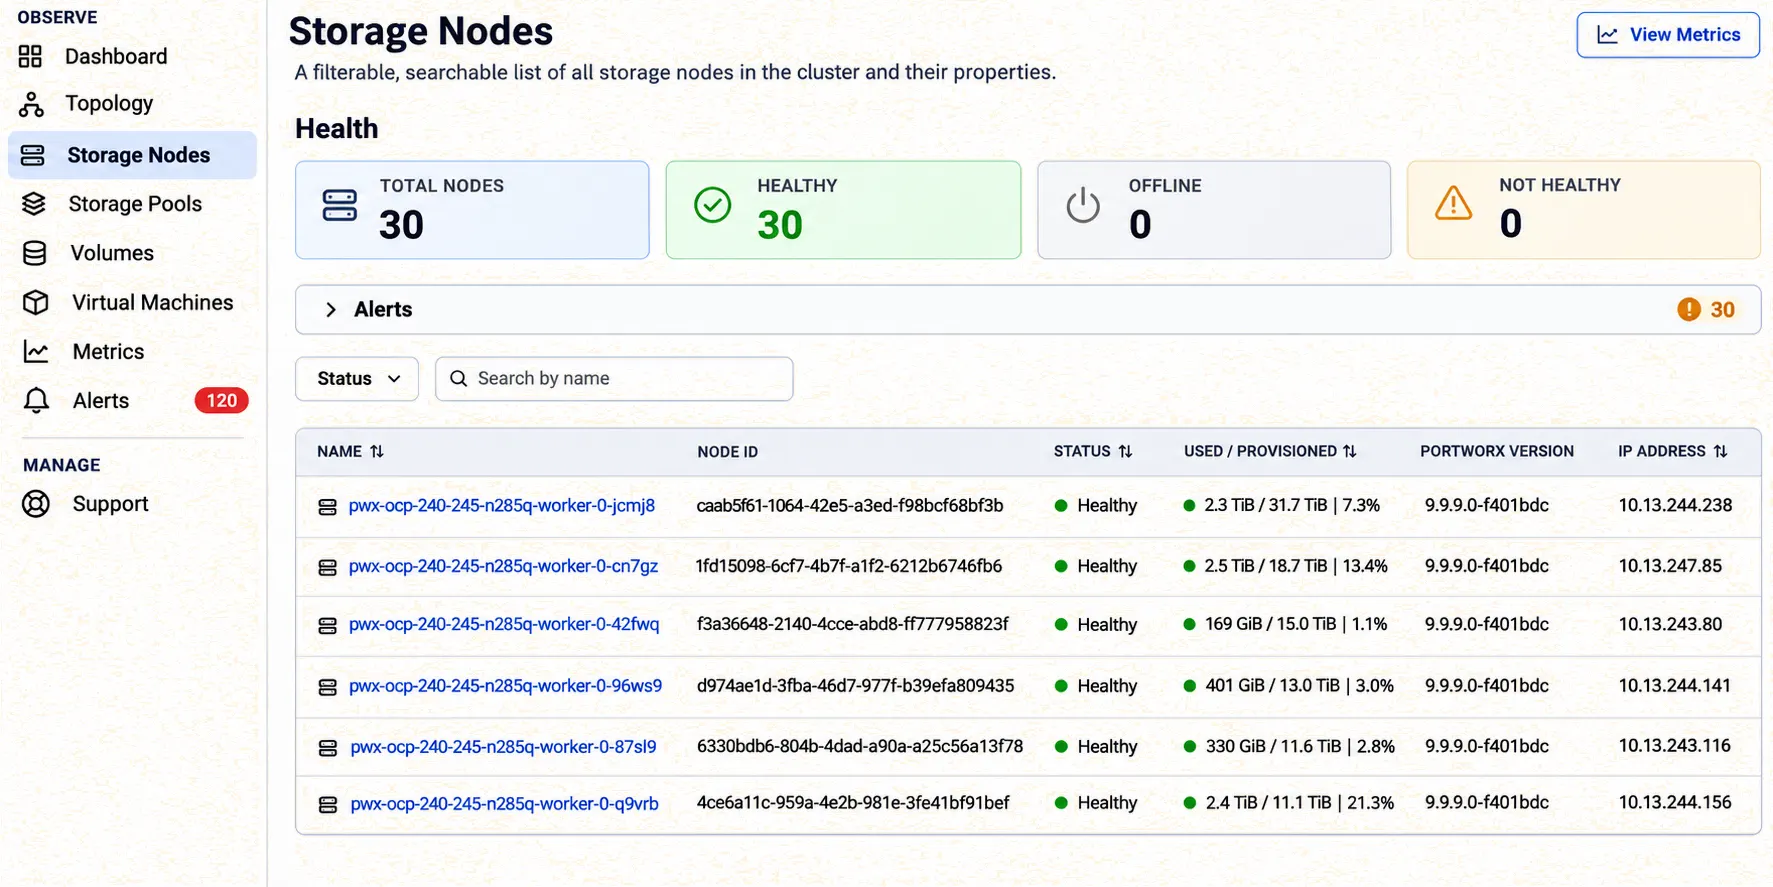
Operations Center provides a centralized inventory of storage nodes, storage pools, volumes, and KubeVirt virtual machines, bringing together resource health, capacity utilization, configuration details, and associated alerts.
Each resource view provides insights relevant to its operational role:
- Storage Nodes: Monitor node health, storage utilization, and operational conditions such as quorum loss, storage degradation, or rebalance activity, helping administrators identify nodes requiring attention.
- Storage Pools: Track pool availability, capacity consumption, and storage characteristics, making it easier to identify pools approaching capacity limits or requiring maintenance.
- Volumes: Examine volume health, capacity utilization, and attachment information to investigate degraded or unavailable volumes and understand their relationship to Kubernetes workloads.
- Virtual Machines: Extend storage visibility to KubeVirt and OpenShift Virtualization environments, allowing administrators to review VM health, placement, and associated alerts alongside the underlying storage infrastructure.
For example, when a storage node becomes unhealthy, administrators can quickly identify the affected node, review its operational status and capacity information, and investigate associated alerts without manually gathering details from multiple command-line tools.
By bringing infrastructure and workload information into a unified operational experience, Operations Center helps administrators move from cluster-level issue detection to resource-level investigation.
Unified Alert Visibility Across Prometheus and Portworx
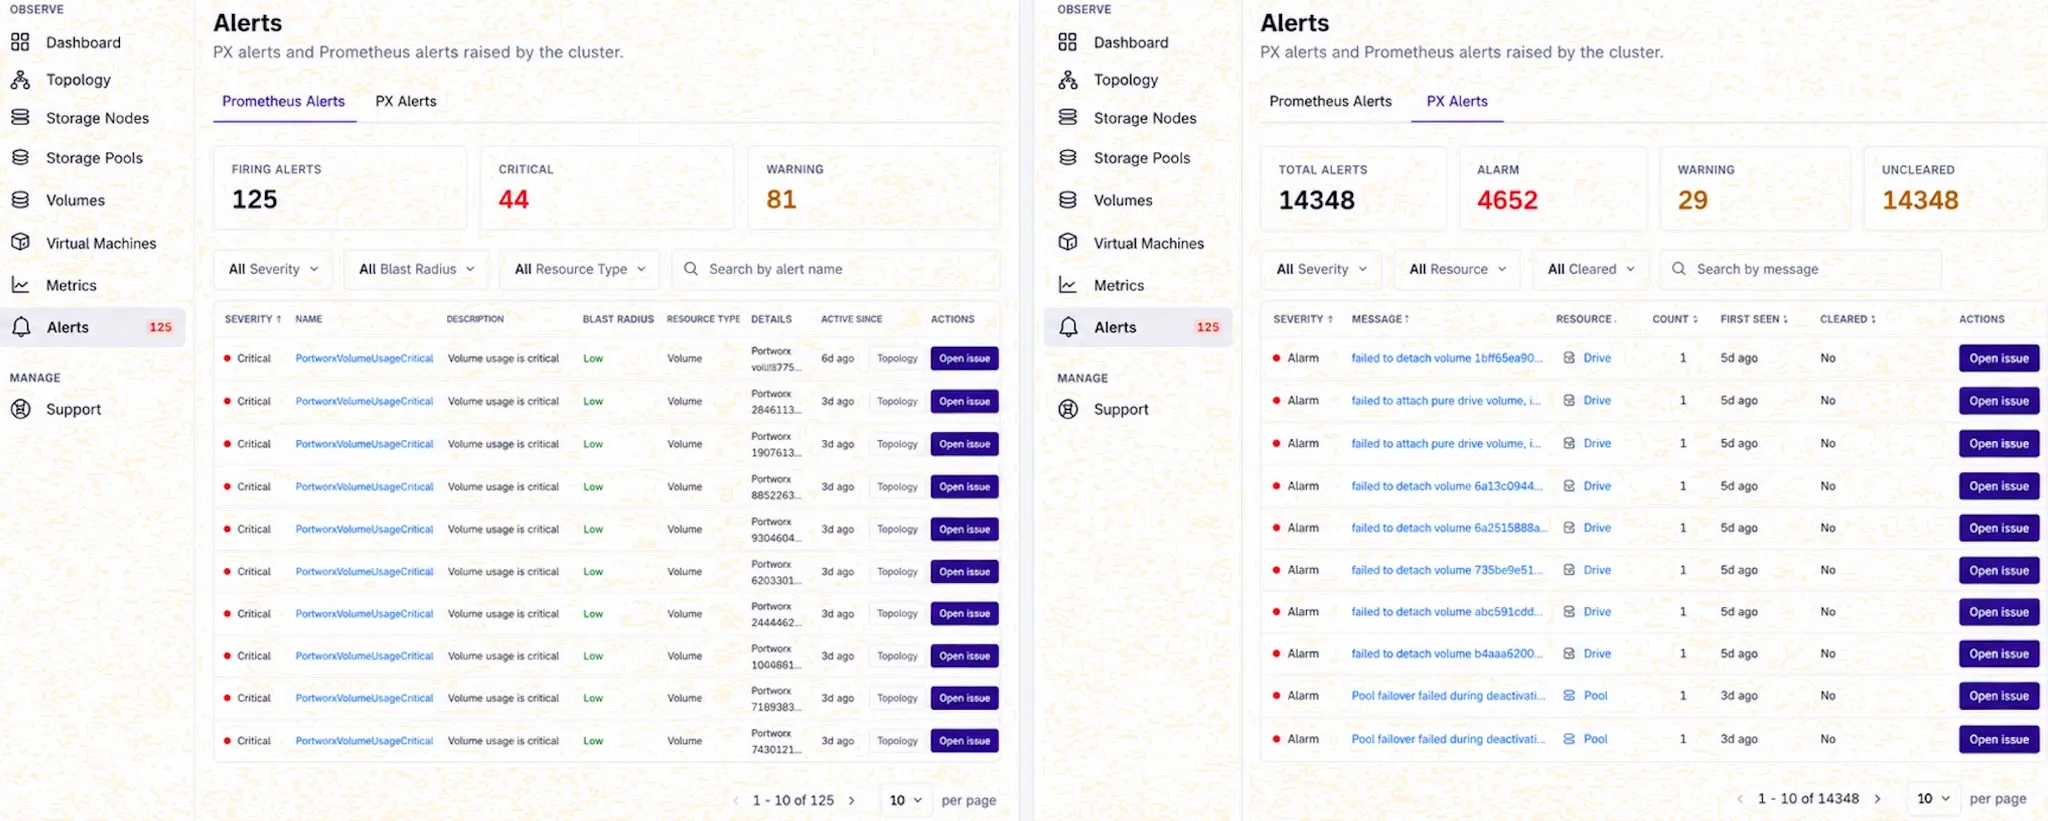
Effective storage troubleshooting requires visibility into both infrastructure monitoring alerts and storage-specific events. While Prometheus detects conditions based on configured monitoring rules, Portworx generates native alerts that provide additional information about storage operations and resource health.
Operations Center brings these two alert sources into a unified interface, allowing administrators to investigate storage-related conditions without switching between separate monitoring and storage management tools.
Prometheus Alerts provide visibility into rule-based conditions affecting storage health, performance, and availability. In addition to severity and alert details, Operations Center provides blast-radius information and identifies the associated resource types, helping administrators assess potential impact and investigate affected infrastructure through issue and topology views.
Portworx (PX) Alerts provide access to native Portworx alerts, including severity, affected resources, occurrence counts, and whether an alert has been cleared. This helps administrators understand storage-specific events, distinguish ongoing conditions from historical alerts, and investigate recurring issues.
Together, these alert sources provide a more complete picture of storage health by combining monitoring-generated signals with Portworx-specific operational information.
By connecting alerts with resource context and impact information, Operations Center helps administrators focus on understanding and investigating storage issues rather than manually correlating alerts across different tools.
Performance Insights and Contextual Metrics
Understanding storage performance requires more than monitoring individual metrics. When investigating high latency, increased I/O activity, or capacity concerns, administrators need to examine performance trends alongside the health and configuration of the affected storage resources.
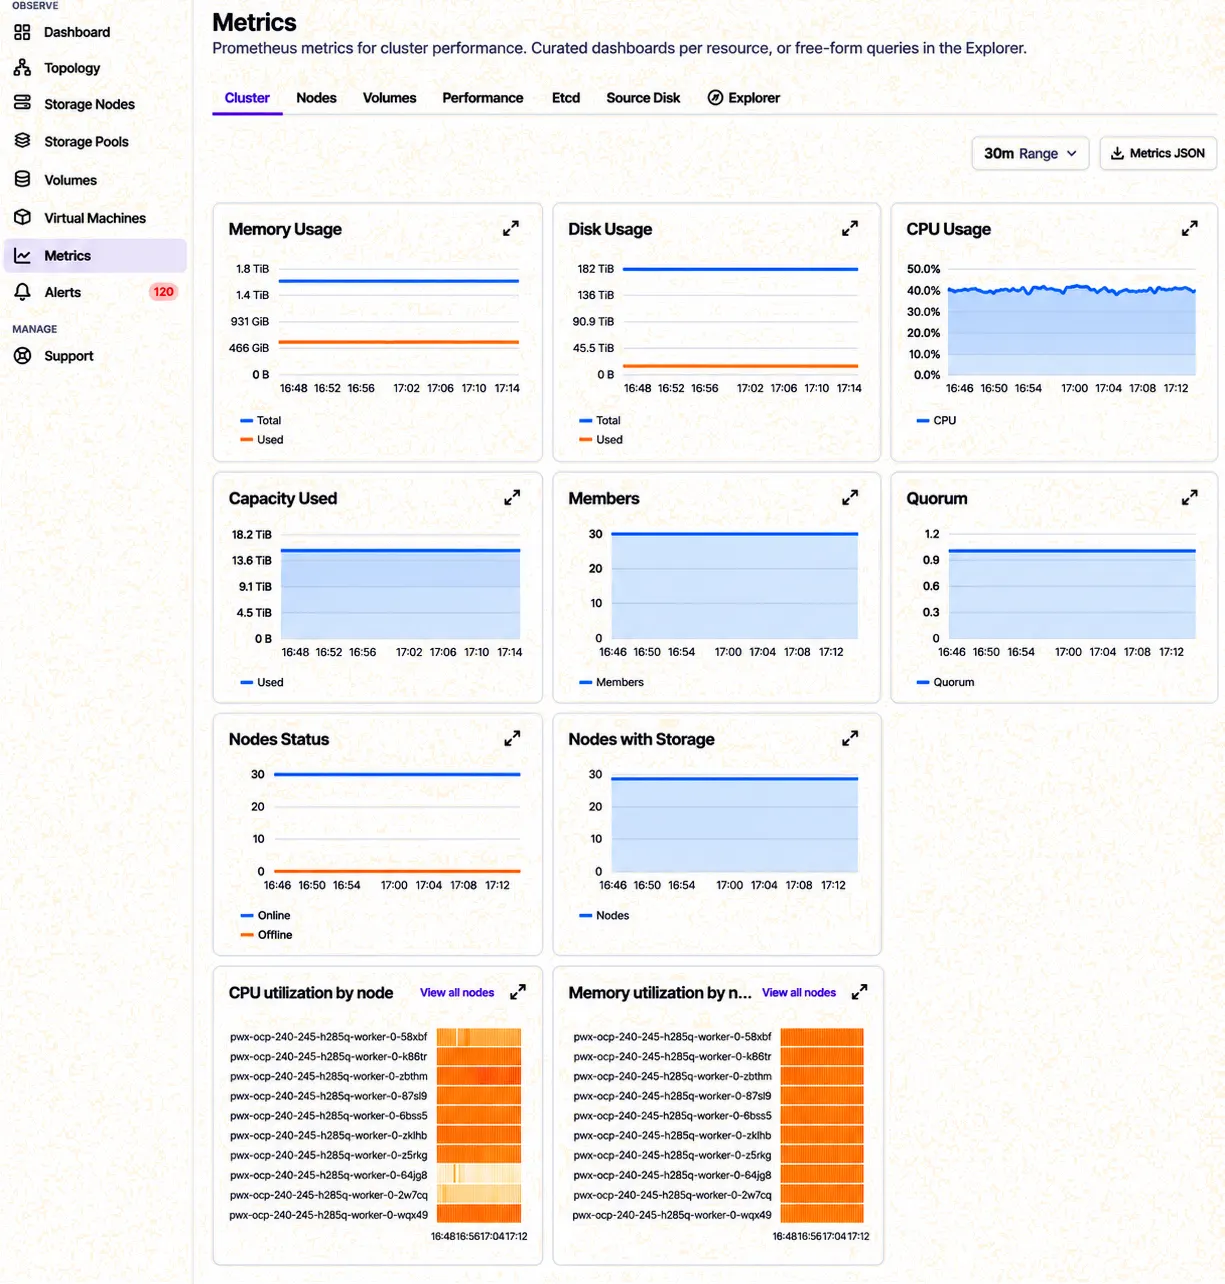
Operations Center brings Prometheus-based performance metrics and Grafana dashboards into the same operational interface used to investigate cluster health, alerts, and storage infrastructure.
Preconfigured dashboards provide visibility across different layers of the environment:
- Cluster: Overall resource utilization, storage capacity, cluster membership, quorum, and node health.
- Nodes: Node-level CPU, memory, network activity, disk I/O, throughput, and latency.
- Volumes: Volume-level read/write latency, IOPS, throughput, I/O depth, and capacity utilization.
- Performance: Detailed storage performance across nodes, volumes, replicas, caches, and storage pools.
- Etcd: Key metrics related to database performance, disk synchronization, Raft operations, and leader elections.
A key benefit is the ability to investigate metrics in the context of specific resources. Administrators can narrow their analysis to individual nodes, storage pools, namespaces, or persistent volume claims (PVCs), making it easier to examine the performance behavior of affected infrastructure without manually navigating multiple monitoring dashboards.
For deeper investigations, Metrics Explorer provides access to available metrics, predefined queries, and custom PromQL queries. This flexibility allows administrators to move beyond preconfigured dashboards when investigating specific performance conditions.
By bringing performance telemetry together with storage resource information, Operations Center helps administrators connect infrastructure health with performance behavior, supporting more focused and efficient troubleshooting.
Simplifying Diagnostics and Support
Not every storage issue can be resolved through alerts, topology, and performance metrics alone. Complex incidents often require additional diagnostic information for deeper investigation or assistance from Portworx Support.
Traditionally, collecting diagnostic bundles involves accessing storage nodes, executing pxctl commands, and manually retrieving the generated files for analysis or sharing with support.
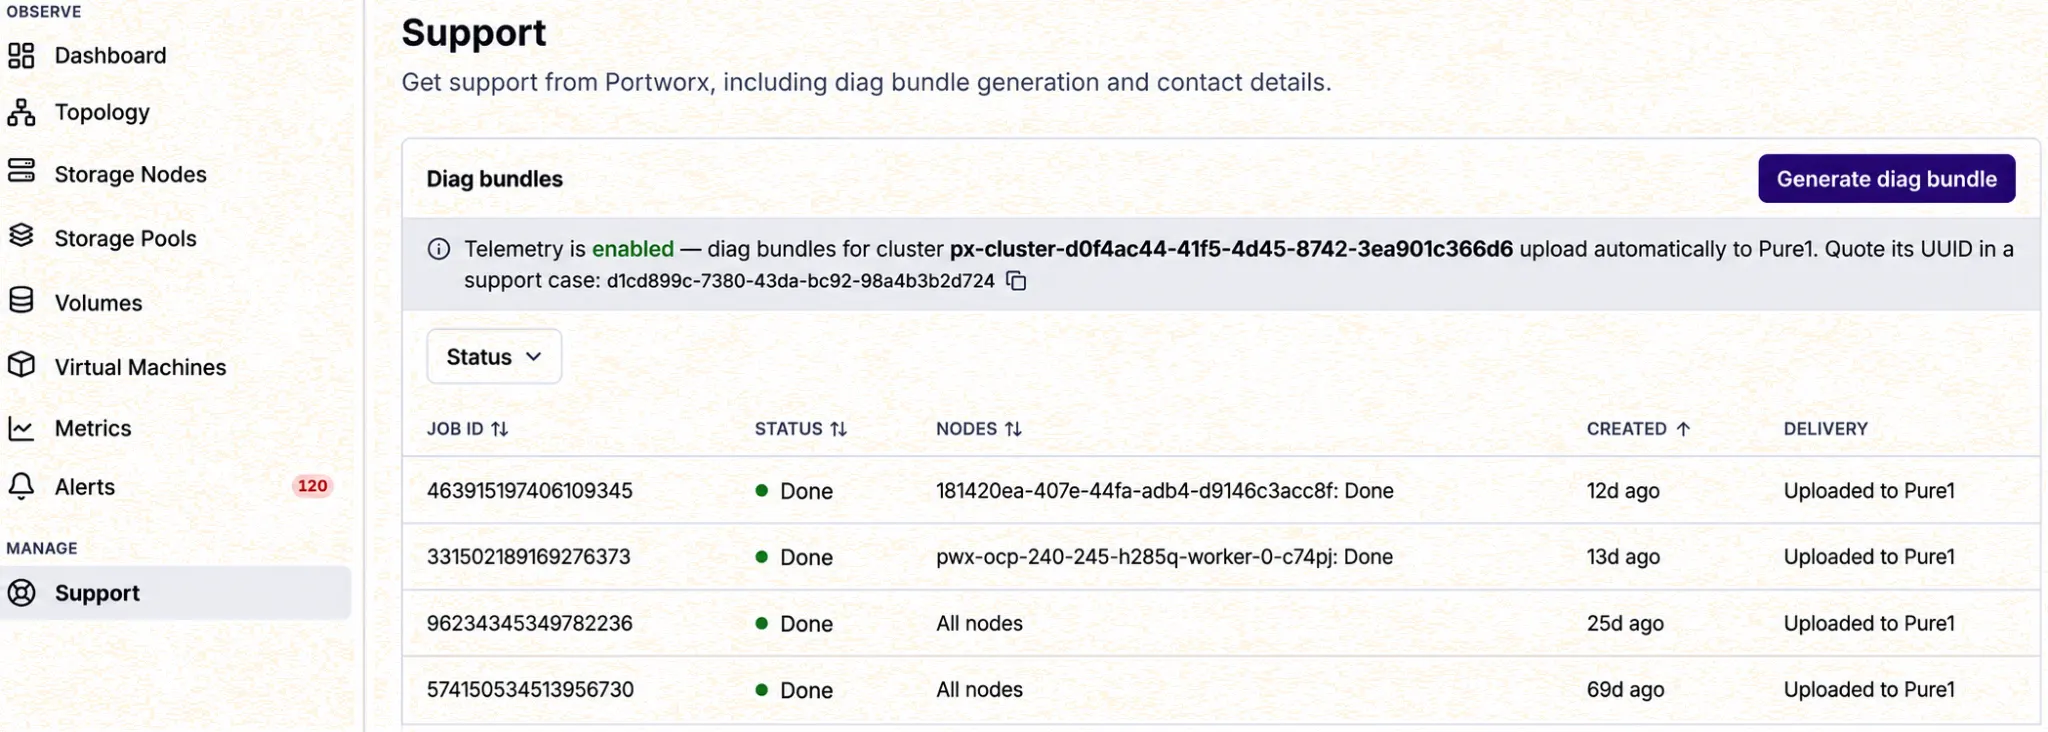
Operations Center simplifies this process by allowing administrators to generate diagnostic bundles directly from the Support interface, eliminating the need to manually access individual storage nodes.
When telemetry is enabled, diagnostic bundles are automatically uploaded to Pure1, streamlining the process of sharing diagnostic information with Portworx Support. Administrators can also track previously generated bundles, including their collection status, associated nodes, and delivery information.
The Support interface also provides the cluster UUID, making it easier to identify the affected environment when opening or updating a support case.
By integrating diagnostic collection and automated upload into the Operations Center experience, it simplifies support workflows and reduces the manual effort involved in troubleshooting complex storage issues.
Summary – Bringing Context to Kubernetes Storage Operations
As Kubernetes environments grow, managing storage health, performance, and availability becomes increasingly complex. While traditional monitoring tools provide essential metrics and alerts, understanding their impact often requires correlating information across multiple systems.
Operations Center simplifies this process by bringing cluster health, issue triage, impact visualization, infrastructure topology, contextual performance metrics, and diagnostic capabilities into a unified operational experience.
By connecting alerts with the underlying storage resources and workloads, administrators can identify issues, understand their potential impact, investigate performance behavior, and streamline support workflows without constantly switching between tools.
Operations Center goes beyond monitoring by turning storage telemetry into actionable insights, helping administrators simplify Day-2 operations and troubleshoot with greater context and efficiency.
Reference
Recommended for you