It’s midnight and you wake up to a PagerDuty alert notifying you of an escalation for a production application. Your team rushes to open a Slack channel and bridge so that you can come together to diagnose and fix the problem. Some time later, the issue is fixed for the customer and they ask for an RCA (Root Cause Analysis) to ensure that it doesn’t happen again.
You spend hours with the team trying to reproduce the bug in development and can’t seem to hit the same issues that came up in production. One thought you have is that the data the application was processing in production at the time may have caused it, but you can’t easily reproduce such a scenario. The RCA is completed using the explanation “It was a rare corner case possibly caused by a data value that affected normal operations.” In other words,
¯\_(ツ)_/¯ .
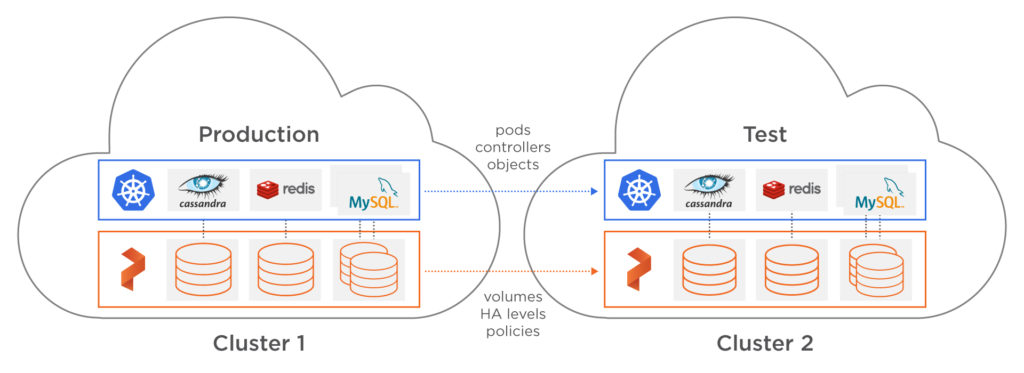
Sound familiar? Even using a containerized environment which provides an immutable version of an application, OS, and operating environments, fully reproducing an error in a production environment often requires production data. One way to enable production data for testing is to have proper CDM (Copy Data Management) tools. CDM tools give the ability manage the creation, use, distribution, retention, and clean-up of copies of production data — or “copy data.” With the new Portworx PX-Enterprise™ release, PX-Motion can empower teams to achieve this result by enabling data mobility for copies of data and applications from one Kubernetes cluster to another. This can allow teams to fully reproduce a production environment for easier debugging.
In this blog post, we’ll show a running production Kubernetes cluster that is having an issue with a WordPress + MySQL deployment. When an initial investigation doesn’t turn up any obvious errors that would cause the issue, we’ll use PX-Motion to copy the application configuration and the data to a test cluster to help debug the problem. At the same time, we will restore normal operations to our production cluster by using a snapshot clone for MySQL.
In this demo, we will use Amazon’s EKS (Elastic Kubernetes Service) for our Kubernetes cluster. Below is a short list describing the environment.
- One VPC deployed with 3 Availability Zones.
- Two EKS clusters deployed to one VPC, (Prod & Test), each running Portworx
- WordPress + MySQL running on the production cluster.
Pre-requisites
If you are trying out PX-Motion, make sure and have all necessary prerequisites complete.
A bug in production
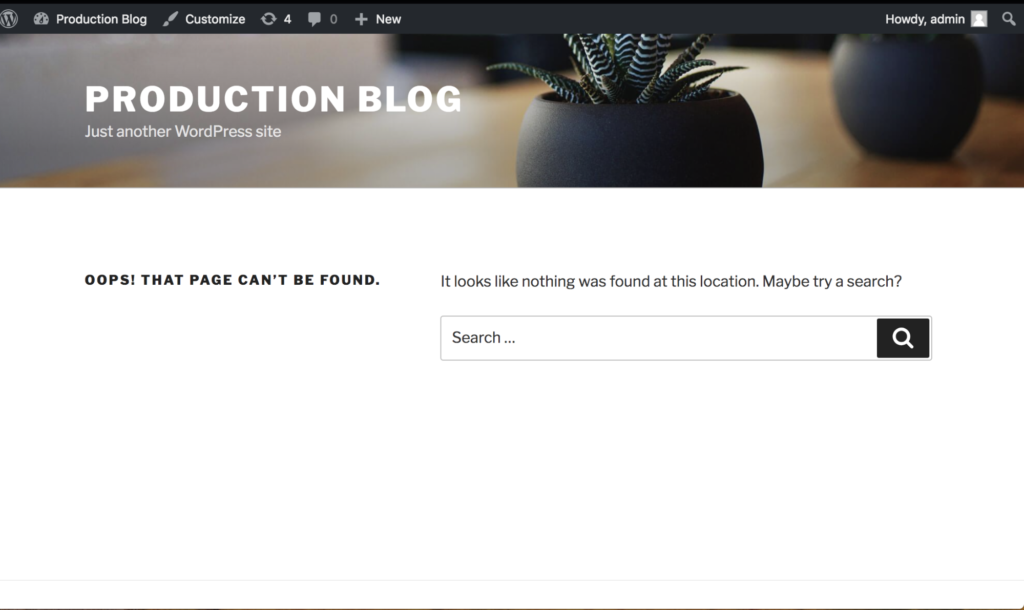
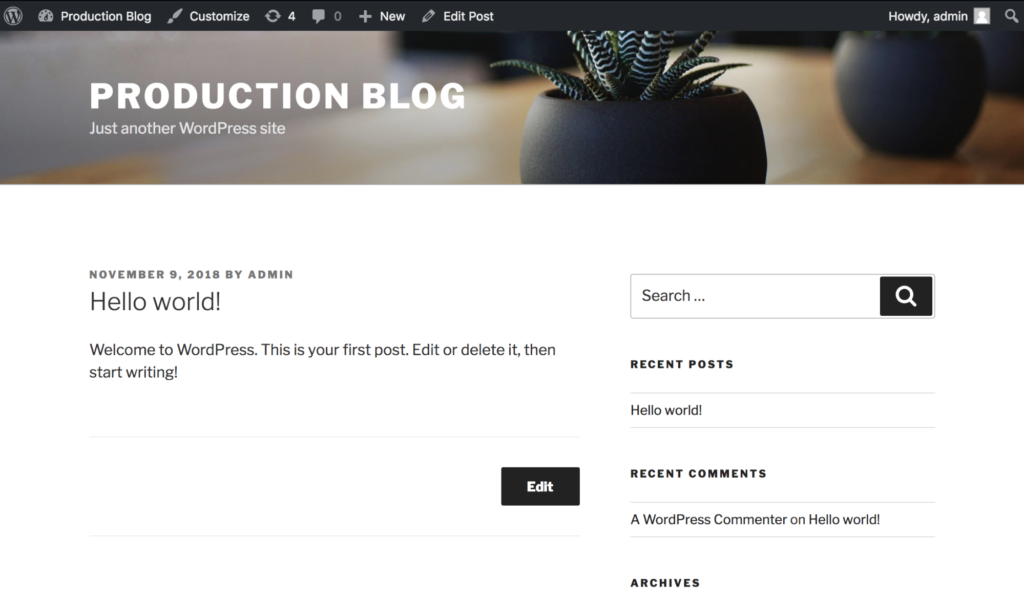
A WordPress + MySQL blog is running on a Kubernetes production cluster which we’ll refer to as the “source cluster.” It is critical this blog remains functional. Below is a screenshot of our blog running. It’s backed by a MySQL database with Portworx providing replicated block volumes for High Availability.

Also, because we need to be ready for anything, we regularly take group snapshots of our MySQL and file volumes (not shown in this blog) for any future recovery efforts.
Now, let’s say a bug in production is found and the team is not really sure what is causing the error. It would be good to triage this issue in a test environment, however, the real data in our production environment isn’t available in test.
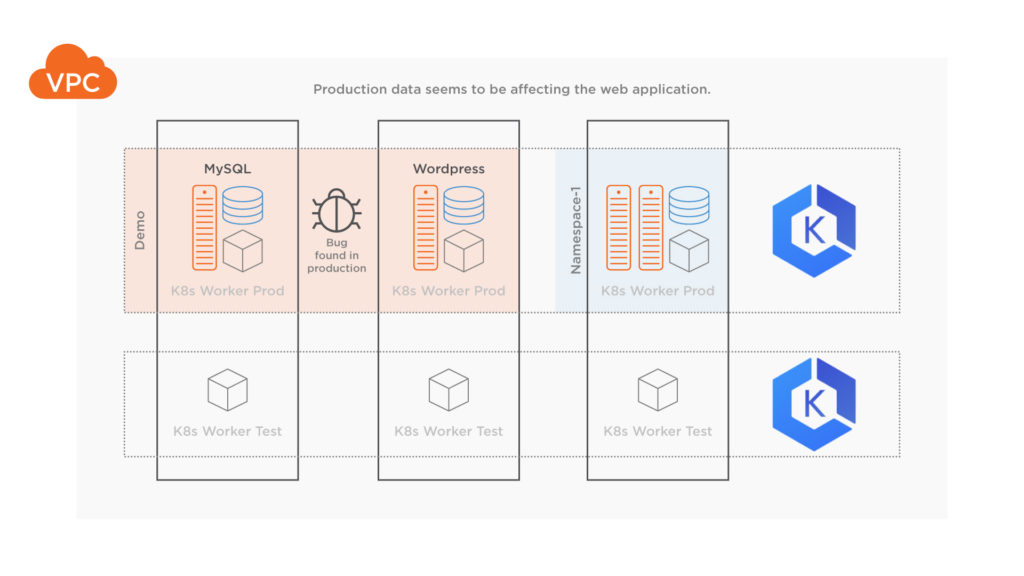
The bug is causing the production blog to show an error that it can’t find the post that was being served in production originally (screenshot below), both MySQL and WordPress containers seem to be in Running state, so the team decides it needs to look at the data within MySQL to find out more.
We’ll use PX-Enterprise to fix the issue. First, we will use PX-Motion to copy over application data, configuration, and pods from our production cluster to our test cluster. That way we can fully reproduce the error occuring in production. Once that is done, we will restore our production cluster to a previous known good state using a snapshot backup that we have taken previously with PX-Enterprise. Now, while we debug, our application can continue to serve traffic.
In this demo we’ll move volumes and Kubernetes resources to the new cluster using PX-Motion. However, it is also possible to use Portworx to migrate just data volumes if you already have a cluster with the proper configuration, but you are just missing the latest data. It depends on your use case.
How to pair Kubernetes clusters for data and configuration migration
Below is an example of pairing two EKS clusters in the same VPC so that we can move data between them. Pairing is a concept similar to the way that you would pair a mobile phone with a bluetooth speaker in order to use the two distinct devices together. This step only has to be done once and can be done when clusters are initially setup or post setup.
First, set up the destination cluster for the pairing.
$ aws eks update-kubeconfig --name test-destination-cluster
Setup access to pxctl (“pixie-cuttle”), the Portworx CLI. Here we’re using kubectl and an alias to setup pxctl on a local workstation.
$ PX_POD_DEST_CLUSTER=$(kubectl get pods --context
  <DESTINATION_CLUSTER_CONTEXT> -l name=portworx -n kube-system -o
  jsonpath='{.items[0].metadata.name}')
$ alias pxctl_dst="kubectl exec $PX_POD_DEST_CLUSTER \
    --context <DESTINATION_CLUSTER_CONTEXT> \
     -n kube-system /opt/pwx/bin/pxctl"
Next, setup the destination cluster to be ready to pair with our source cluster. To do this, the destination cluster should first run a Portworx objectstore. We need to set up an object storage endpoint on the destination cluster because this is where our data will be staged during the migration.
Then, produce a token for our source cluster to use during the pairing.
$ pxctl_dst -- volume create --size 100 objectstore
$ pxctl_dst -- objectstore create -v objectstore
$ pxctl_dst -- cluster token show
Token is <UUID>
Next, create the cluster pair YAML configuration file that will get applied to the source Kubernetes cluster. This clusterpair.yaml file will include information about how to authenticate with the destination cluster scheduler and Portworx storage. A cluster pair can be created by running the following command and editing the YAML file:
$ storkctl generate clusterpair --context <destination-cluster> > clusterpair.yaml
> Note that you can replace metadata.name with your own name.
> Note that for options.token in the below example, use the token produced from the cluster token show command above.
> Note that for options.ip in the below example, a reachable IP or DNS of a load balancer or Portworx node will be needed for access to ports 9001 and 9010.
Next, apply this cluster pair on the source cluster by using kubectl.
$ kubectl config use-context <source-cluster>
$ kubectl create -f clusterpair.yaml
Once applied, check the status of the the cluster pair using storkctl which should have been setup during pre-requisites.
$ storkctl get clusterpair
NAME STORAGE-STATUS SCHEDULER-STATUS CREATED
cluster-2-pair Ready Ready 09 Nov 18 11:36 EST
The cluster pair is also available using kubectl.
$ kubectl describe clusterpair | grep Status
Status:
Scheduler Status: Ready
Storage Status: Ready

$ pxctl cluster pair list
CLUSTER-ID                                     NAME           ENDPOINT               CREDENTIAL-ID
4d4f7db9-2e97-431c-91b4-35a3388f558d (default) px-cluster-two http://10.0.1.122:9001 189aae63-8b75-4fa7-add1-5796706cf04d
Now that the clusters are paired correctly, it is possible to migrate persistent volume claims, persistent volumes, deployments, replicasets, namespaces and other configuration from one cluster to another.
Let’s start the migration of our production application and data over to the test cluster.
$ kubectl config use-context <SOURCE_CLUSTER_CONTEXT>
$ storkctl create migration bugmigration \
     --clusterPair cluster-2-pair \
     --namespaces prod_app_123 \
     --includeResources \
     --startApplications
Migration bugmigration created successfully
Below is a diagram depicting the movement of volumes and resources from the production Kubernetes cluster to the destination test Kubernetes cluster.
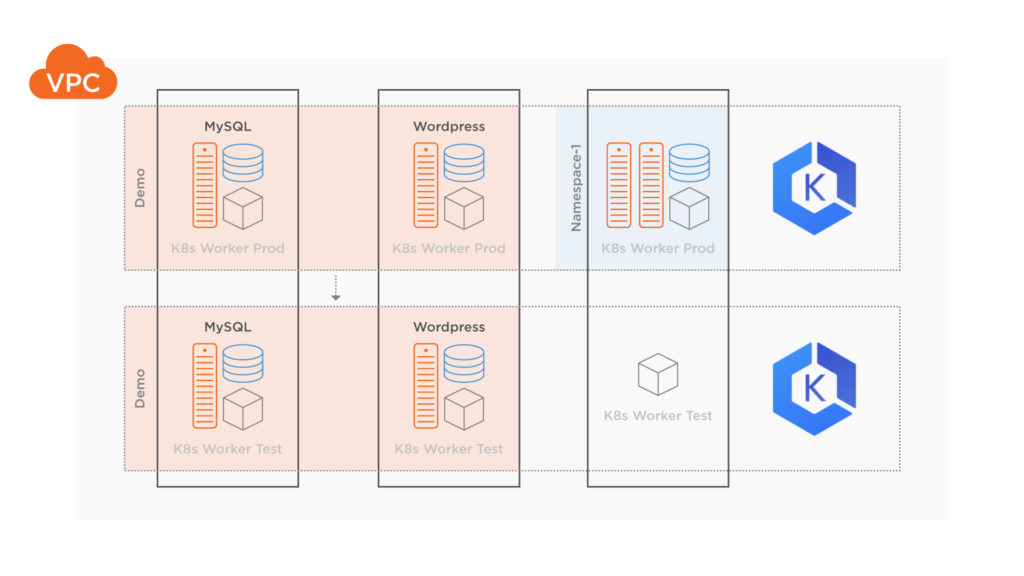
Now, check on the status and make sure the migration completes successfully. The migration will show the following stages if it completes successfully: Volumes→ Application→Final
$ storkctl get migration
NAME         CLUSTERPAIR    STAGE   STATUS     VOLUMES RESOURCES
bugmigration cluster-2-pair Volumes InProgress 0/2     0/9

$ storkctl get migration
NAME         CLUSTERPAIR    STAGE       STATUS     VOLUMES RESOURCES
bugmigration cluster-2-pair Application InProgress 2/2     2/9

$ storkctl get migration
NAME         CLUSTERPAIR    STAGE STATUS     VOLUMES RESOURCES
bugmigration cluster-2-pair Final Successful 2/2     9/9
Kubectl can be used to describe the different events of a migration. Data such as age, type and reason are available for different resources and volumes being migrated.
$ kubectl describe migration
.
. <snip>
.
Events:
Type Reason Age From Message
---- ------ ---- ---- -------
Normal Successful 37m stork Volume pvc-7a4c65d6-e43e-11e8-a5c8-1218338a41b6 migrated successfully
Normal Successful 37m stork Volume pvc-7a5553fd-e43e-11e8-a5c8-1218338a41b6 migrated successfully
Normal Successful 37m stork /v1, Kind=PersistentVolume /pvc-7a4c65d6-e43e-11e8-a5c8-1218338a41b6: Resource migrated successfully
Normal Successful 37m stork /v1, Kind=PersistentVolume /pvc-7a5553fd-e43e-11e8-a5c8-1218338a41b6: Resource migrated successfully
Normal Successful 37m stork /v1, Kind=Secret default/mysql-pass: Resource migrated successfully
Normal Successful 37m stork /v1, Kind=PersistentVolumeClaim default/mysql-pvc-1: Resource migrated successfully
Normal Successful 37m stork /v1, Kind=PersistentVolumeClaim default/wp-pv-claim: Resource migrated successfully
Normal Successful 37m stork /v1, Kind=Service default/wordpress: Resource migrated successfully
Normal Successful 37m stork /v1, Kind=Service default/wordpress-mysql: Resource migrated successfully
Normal Successful 37m (x2 over 37m) stork (combined from similar events): apps/v1, Kind=Deployment default/wordpress-mysql: Resource migrated successfully
Next, verify that the destination test cluster is running the production containers and volumes that are expected.
$ kubectl config use-context <DESTINATION_CLUSTER_CONTEXT>

$ kubectl get po
NAME READY STATUS RESTARTS AGE
wordpress-6d4975d96-6cpgx 1/1 Running 1 35m
wordpress-6d4975d96-969pl 1/1 Running 1 35m
wordpress-6d4975d96-jzjfn 1/1 Running 0 35m
The destination cluster has the PVCs and they are attached and running to the app that was running in production.
pxctl_dst volume list
ID                        NAME                                       SIZE        HA  SHARED  ENCRYPTED  IO_PRIORITY  STATUS                        HA-STATE  SNAP-ENABLED
57249849036590633         objectstore                                100 GiB     1   no      no         LOW          up - attached on 10.0.1.122   Up        no
929095742540565214        pvc-7a4c65d6-e43e-11e8-a5c8-1218338a41b6   2 GiB       1   no      no         LOW          up - attached on 10.0.3.72    Up        yes
1143505011624977868       pvc-7a5553fd-e43e-11e8-a5c8-1218338a41b6   1 GiB       1   yes     no         LOW          up - attached on 10.0.2.214   Up        no
To make sure it’s the same data, let’s connect to the blog that is now running on the test cluster. We should see the same “bug” that we saw manifest in production since we are using the same data.
$ kubectl port-forward --namespace demo service/wordpress 8080:80

Great! We can see the bug in the test cluster running the copy of the blog. This is exactly what we’d expect since it’s using the same data from production.
Restoring Production
Now that we’ve got our test environment set up, let’s get our production environment up and running again, before diving into debugging. After all, our users are waiting.
We’ll restore the production cluster to a known working state by using a clone of a snapshot that we had taken previously (not shown in this blog post). Below is a spec that will create a clone from a snapshot that Portworx had previously taken of our production database.
$ kubectl config use-context <SOURCE_CLUSTER_CONTEXT>

apiVersion: v1
kind: PersistentVolumeClaim
metadata:
name: mysql-snap-clone
annotations:
snapshot.alpha.kubernetes.io/snapshot: mysql-snapshot-1218338a41b6
spec:
accessModes:
- ReadWriteOnce
storageClassName: stork-snapshot-sc
resources:
requests:
storage: 2Gi
Check to make sure the PVC from the snapshot is created.
$ kubectl get pvc | grep clone
mysql-snap-clone Bound pvc-c7c48c10-e458-11e8-b395-02209b13ff52 2Gi RWO stork-snapshot-sc 18s
Now, edit the production MySQL deployment to use the “mysql-snap-clone” claim that we created earlier so it can be restored and the production site can begin serving the post again.
$ kubectl edit deployment wordpress-mysql

(Edit the following persistentVolumeClaim to use the clone)
volumes:
- name: mysql-persistent-storage
persistentVolumeClaim:
claimName: mysql-snap-clone
After editing, the MySQL instance will come back online using the clone of the snapshot.
$ kubectl get po
NAME                            READY STATUS      RESTARTS AGE
wordpress-6d4975d96-2ktbs       1/1   Running     0        2h
wordpress-6d4975d96-hr9c9       1/1   Running     0        2h
wordpress-6d4975d96-qdwnr       1/1   Running     0        2h
wordpress-mysql-b54948958-wttkg 0/1   Terminating 0        3h
Now if we refresh the page on the production site, the data should be back!
Debugging the test cluster
Now that our site is up and running again, let’s figure out what went wrong.
First, we will connect to the destination cluster where we moved the production data and try to see what caused the issue. While looking at the test cluster’s copy of the site, we can see that it looks like the post has been removed or at least the data has been changed, modified or corrupted.
It’s a good idea to now check the data in the MySQL database to see if there has been any data corruption. To do this, connect to the destination cluster vis kubectl and exec into the MySQL pod and use the mysql client.
$ kubectl config use-context <destination-cluster>
$ kubectl exec -it wordpress-mysql-b54948958-p6kcj bash
$ root@wordpress-mysql-b54948958-p6kcj:/# mysql
Use the WordPress database
mysql> use wordpress;
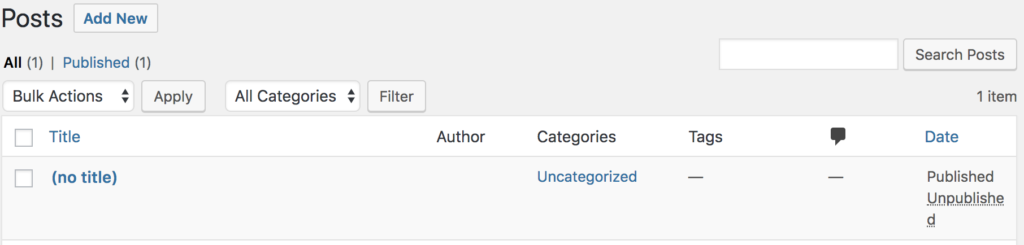
Check the data within the posts table (below). It looks like the record has been replaced or corrupted which is causing the URL to fail because it cannot find the appropriate record from the database.
mysql> select * from wp_posts LIMIT 1;
+----+-------------+---------------------+---------------------+--------------+------------+--------------+-------------+----------------+-------------+---------------+-----------+---------+--------+---------------------+---------------------+-----------------------+-------------+------+------------+-----------+----------------+---------------+
| ID | post_author | post_date | post_date_gmt | post_content | post_title | post_excerpt | post_status | comment_status | ping_status | post_password | post_name | to_ping | pinged | post_modified | post_modified_gmt | post_content_filtered | post_parent | guid | menu_order | post_type | post_mime_type | comment_count |
+----+-------------+---------------------+---------------------+--------------+------------+--------------+-------------+----------------+-------------+---------------+-----------+---------+--------+---------------------+---------------------+-----------------------+-------------+------+------------+-----------+----------------+---------------+
| 1 | 0 | 0000-00-00 00:00:00 | 0000-00-00 00:00:00 | OH NO, A BUG | | | publish | open | open | | | | | 0000-00-00 00:00:00 | 0000-00-00 00:00:00 | | 0 | | 0 | post | | 0 |
+----+-------------+---------------------+---------------------+--------------+------------+--------------+-------------+----------------+-------------+---------------+-----------+---------+--------+---------------------+---------------------+-----------------------+-------------+------+------------+-----------+----------------+---------------+
1 row in set (0.00 sec)
Since we’ve already restored our site from a known good backup, the only thing left to do is figure out how the data got corrupted which we can do by looking at the logs. Problem solved.
Conclusion
As much as Ops teams perfect their CI/CD pipelines, it’s inevitable that bugs will still manifest in production in ways in that are unexpected and untested. Such bugs may crop up because of unexpected input or data which lies within the database that connects to the application.
PX-Motion introduces the ability to migrate Portworx volumes and Kubernetes resources between clusters. With tools like PX-Motion, you can fully reproduce your production environment for easier debugging and testing. Development and Test isn’t the only use case for PX-Motion. Be sure to check out our other blogs in the Exploring PX-Motion series.
Video Demo
Share
Subscribe for Updates
About Us
Portworx is the leader in cloud native storage for containers.
Thanks for subscribing!

Ryan Wallner
Portworx | Technical Marketing ManagerExplore Related Content:
- data mobility
- kubernetes
- migration
- multicloud