
This blog is part of Demystifying Kubernetes for the VMware Admin, a 10-part blog series that gives VMware admins a clear roadmap into Kubernetes. The series connects familiar VMware concepts to Kubernetes—covering compute, storage, networking, security, operations, and more—so teams can modernize with confidence and plan for what comes next.
Deploying infrastructure is the easy part. Keeping it running, visible, and recoverable is where your real work begins. You know this from years of operating VMware environments. VMware Aria Operations (formerly vRealize Operations) tracks every metric across your vSphere estate. VMware Aria Operations for Logs (formerly vRealize Log Insight) centralizes log data from ESXi hosts, vCenter, and guest operating systems. VMware Live Recovery orchestrates disaster recovery with automated failover plans. vSphere Lifecycle Manager patches ESXi hosts with rolling remediation across clusters.
Following Broadcom’s acquisition of VMware, standalone Aria product licenses were retired. VMware Aria Operations and Aria Operations for Logs are now bundled into VMware Cloud Foundation (VCF) and VMware vSphere Foundation (VVF) subscriptions.
Kubernetes requires the same operational rigor. The tools change. The discipline does not.
The following sections map your VMware Day 2 operations knowledge to the Kubernetes observability and lifecycle management model.
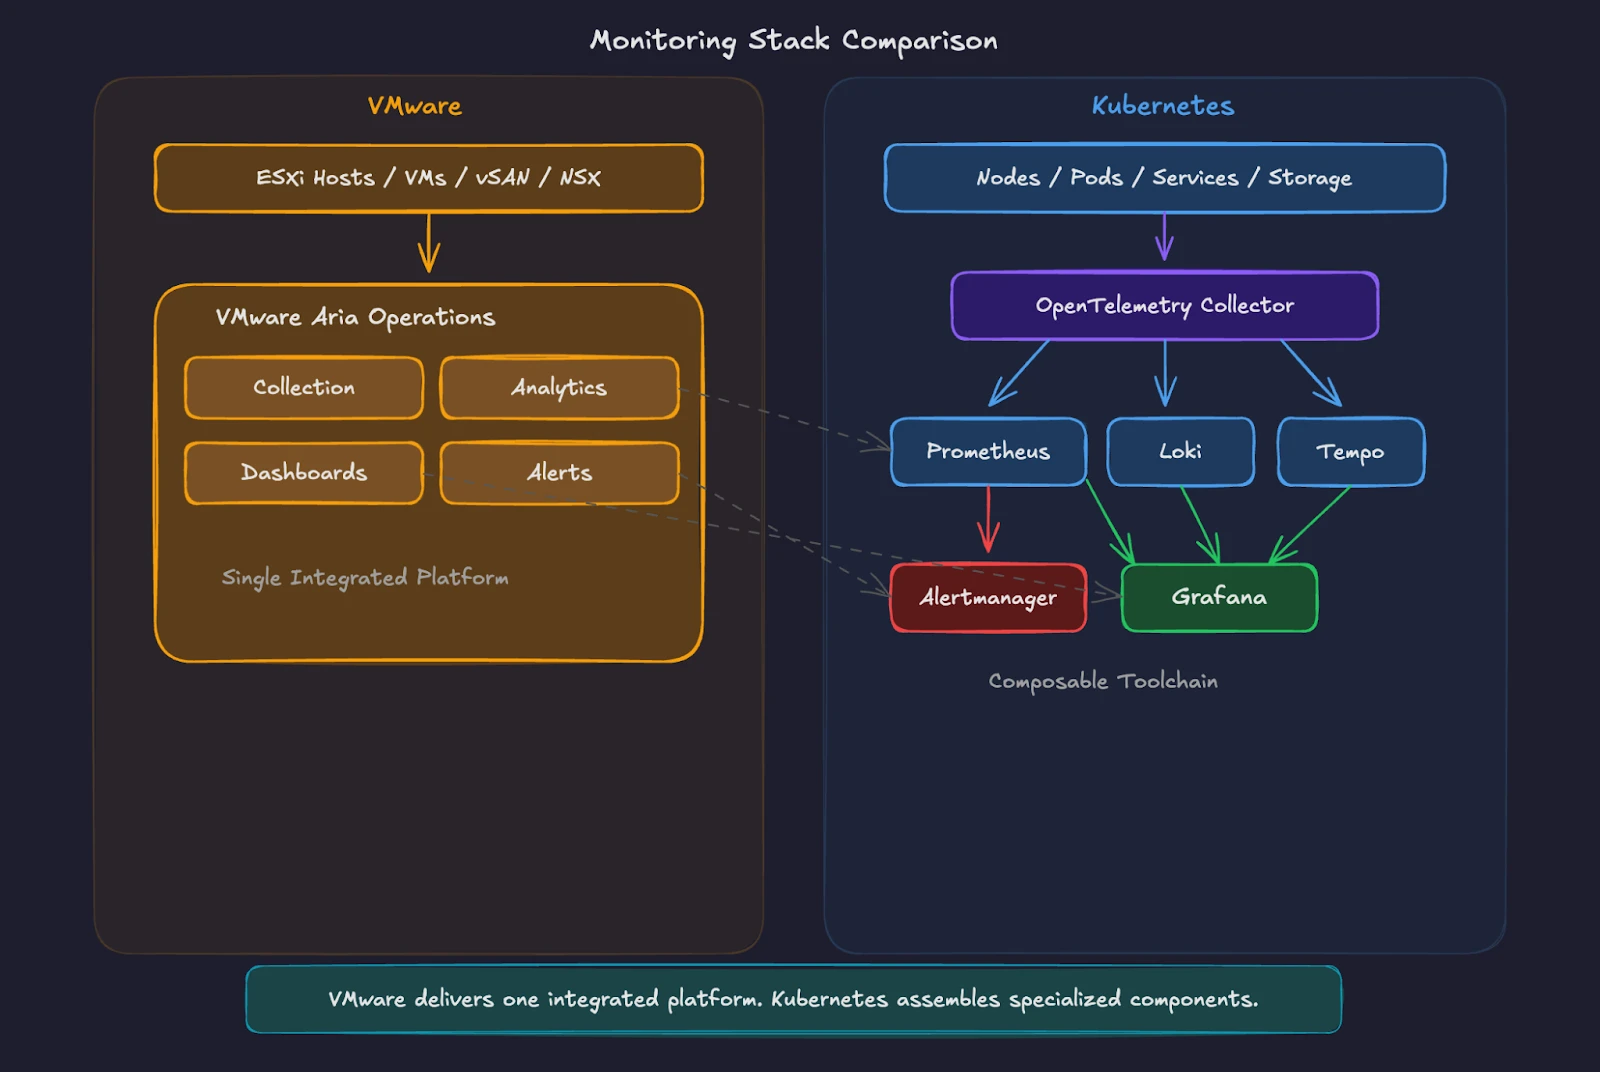
VMware Aria Operations provides a single pane of glass for your entire vSphere environment. It collects metrics from ESXi hosts, VMs, datastores, and network components through built-in adapters. Dashboards show CPU, memory, storage, and network utilization. Predictive analytics forecast capacity exhaustion. Alerts trigger when thresholds breach defined limits. The platform integrates tightly with vCenter and operates as an end-to-end system where data collection, analysis, visualization, and alerting happen within one product.
Kubernetes splits these responsibilities across specialized tools. This modular model reflects Kubernetes’ broader design philosophy. Instead of relying on a single tightly coupled platform, Kubernetes builds on open standards and interchangeable components. Organizations can adopt best-of-breed tools, replace individual pieces over time, or integrate with commercial observability platforms without re-architecting the cluster. The result is greater flexibility and significantly lower risk of vendor lock-in.
Prometheus serves as the metrics collection engine. It scrapes metrics from endpoints exposed by applications, Kubernetes components, and infrastructure exporters at regular intervals. Kubernetes control plane and node components expose Prometheus-format metrics, and production setups typically add exporters and services to round out visibility. The API server and kubelet expose /metrics endpoints. Common add-ons like kube-state-metrics (object state) and node-exporter (node OS metrics) expose additional /metrics endpoints for Prometheus to scrape. Prometheus stores time-series data on local disk by default, and many teams pair it with remote-write and long-term storage backends for retention and global query.
Grafana provides the visualization layer. It connects to Prometheus as a data source and renders dashboards for cluster health, node performance, pod resource consumption, and application-specific metrics. Pre-built dashboards from the Kubernetes Mixin project give you production-ready views comparable to the out-of-the-box dashboards in Aria Operations.
Alertmanager handles alert routing, grouping, and notification delivery. It receives alerts from Prometheus and routes them to Slack channels, PagerDuty, email, or other destinations based on configurable rules.
The key difference is clear. Aria Operations provides an integrated, opinionated monitoring platform. Kubernetes monitoring takes a modular approach. You choose each component independently, swap backends without re-instrumenting applications, and scale each layer (collection, storage, visualization, alerting) to match your specific environment.
Community-driven projects like Prometheus and Grafana evolve faster than proprietary alternatives, with thousands of pre-built exporters, dashboards, and integrations available at no additional licensing cost. You accept operational responsibility for the monitoring infrastructure while gaining full control over architecture decisions, avoiding vendor lock-in, and eliminating per-socket or per-core monitoring fees.
This keeps the VMware acknowledgment honest, then pivots to concrete Kubernetes advantages (modular scaling, faster innovation, zero licensing cost, backend portability) instead of treating the composable model as a tradeoff the reader must tolerate. On the broader note about positioning Kubernetes favorably, I will make sure future chapters frame the Kubernetes approach with equivalent emphasis on its strengths wherever the comparison allows it.
OpenTelemetry has emerged as the CNCF standard for telemetry data collection. The OpenTelemetry Collector is commonly deployed as a DaemonSet (agent mode) on nodes and/or as a Deployment (gateway mode), depending on scale, security, and routing needs. It scrapes Prometheus endpoints, tails container logs, and receives application traces through a single vendor-neutral pipeline. Many production Kubernetes environments run an OpenTelemetry Collector for metrics, logs, and traces, forwarding data to one or more backends.
For VMware administrators, think of Prometheus as the metrics engine (like the Aria Operations analytics cluster), Grafana as the dashboard layer (like the Aria Operations UI), and Alertmanager as the notification system (like Aria Operations alert plugins). OpenTelemetry is the universal data pipeline connecting all signal types.
VMware Aria Operations for Logs provides centralized log management for your VMware environment. It collects logs from ESXi hosts, vCenter, NSX, and guest operating systems through agents and syslog forwarding. Built-in content packs parse VMware-specific log formats and provide structured search, dashboards, and automated event clustering. All logs flow to a central appliance or cluster for analysis.
Kubernetes generates logs differently. Every container writes to stdout and stderr. The container runtime captures these streams and stores them as files on the node. Kubernetes does not provide built-in log aggregation. You need a log collection and analysis stack.
A common approach follows the centralized pattern you know. A node-level collector reads container log files, enriches them with Kubernetes metadata (pod name, namespace, labels), and forwards them to a central backend.
Fluent Bit is one of the most widely used lightweight log collectors for Kubernetes. It runs with minimal resource overhead and supports output to multiple backends. Fluentd serves a similar role with a broader plugin ecosystem for complex log routing and transformation.
Grafana Loki provides log aggregation designed for Kubernetes. It indexes logs by labels (namespace, pod, container) rather than full-text indexing, keeping storage costs low. Loki integrates with Grafana for querying logs alongside metrics in the same dashboard. LogQL, the query language for Loki, follows the same syntax patterns as PromQL for Prometheus.
Elasticsearch with Kibana (the ELK stack) remains a common alternative, especially for teams needing full-text search across log data. It requires more resources and operational effort than Loki but provides richer search and analytics features.
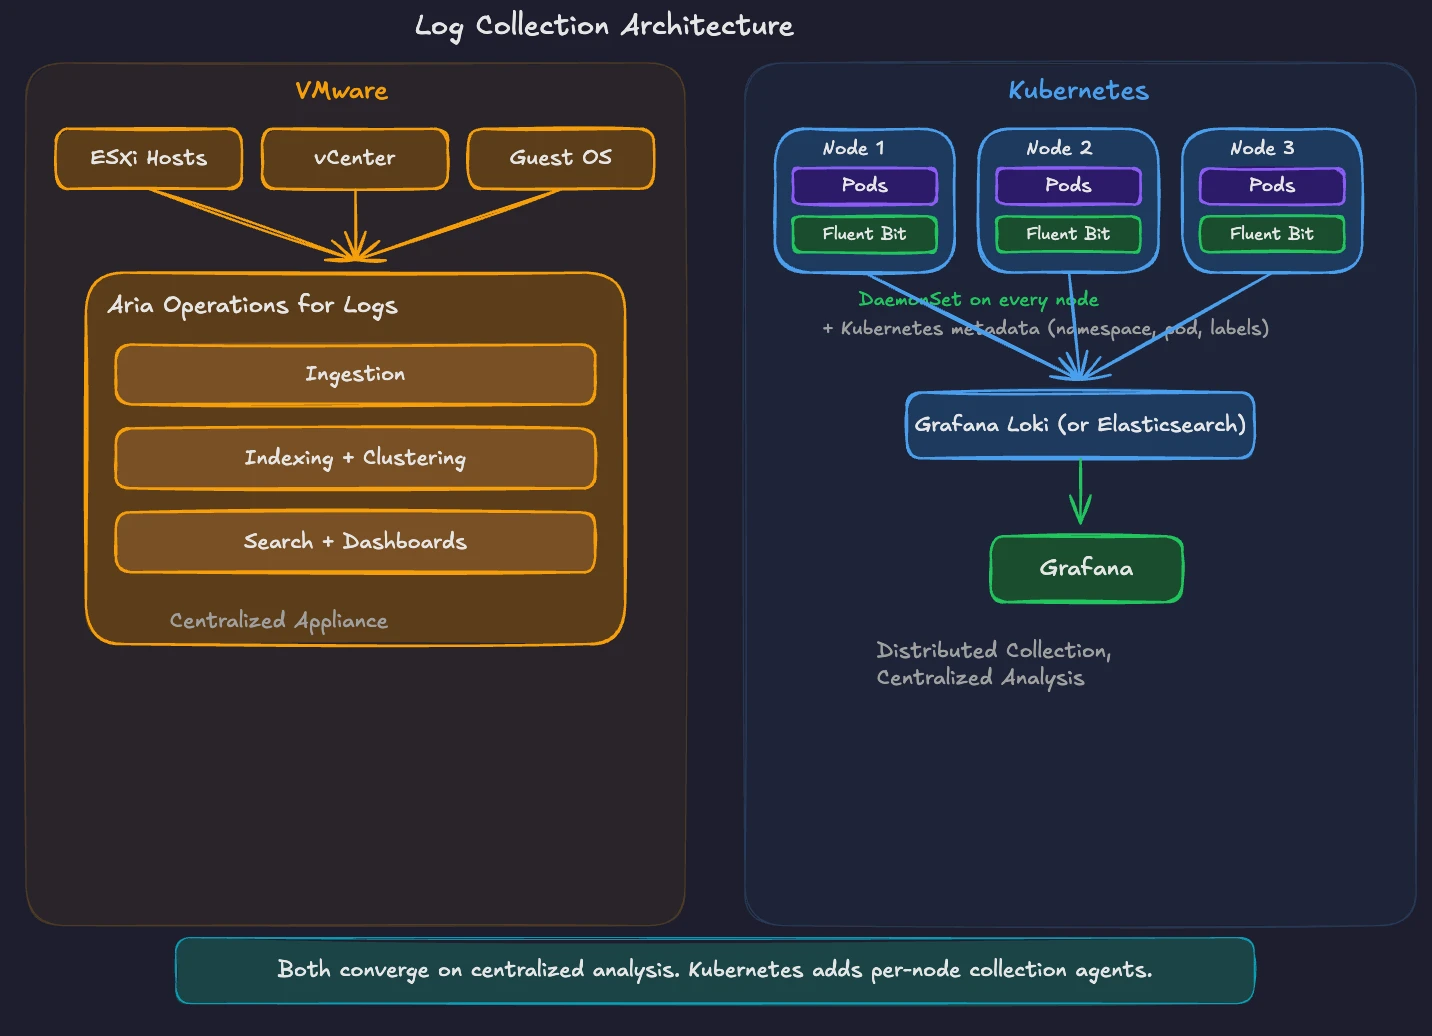
The concept maps directly. Aria Operations for Logs collects, indexes, and analyzes logs from a centralized appliance. In Kubernetes, Fluent Bit or the OpenTelemetry Collector collects logs from every node, and Loki or Elasticsearch stores and indexes them for search and analysis. The architectural pattern is the same. The implementation uses distributed, modular components instead of a single integrated appliance. This design reflects a broader cloud-native observability philosophy. In Kubernetes environments, workloads are ephemeral. Pods are created, rescheduled, and terminated continuously. Instead of relying on logs stored on individual machines or analyzed by a centralized appliance, logs are treated as streams of telemetry that are collected, enriched with metadata, and forwarded through a pipeline to one or more analysis backends. This decoupled model allows teams to scale observability infrastructure independently of the applications producing the data and to adopt new tooling without redesigning the platform.
In VMware, troubleshooting follows a top-down path. Aria Operations detects an anomaly, shows the affected object in the inventory tree, and you drill into the related metrics. You check vCenter events and tasks. You open Aria Operations for Logs and correlate timestamps. The integrated platform provides context at every step.
Kubernetes troubleshooting works bottom-up. You start with kubectl to check pod status, describe resources, and read logs. You check events in the namespace for scheduling failures, image pull errors, or resource constraints. You use Prometheus metrics to identify patterns over time. You query Loki or Elasticsearch for log entries matching the timeframe.
The modern Kubernetes observability approach unifies these signals through correlation. Grafana dashboards link metrics, logs, and traces. Click a spike in CPU usage on a Grafana dashboard, and drill into the logs for the affected pods during the same window. Follow a distributed trace from Grafana Tempo or Jaeger to see request flow across services and identify where latency accumulates.
For alerting, Prometheus rules define conditions based on metrics expressions. When a rule evaluates to true for a specified duration, it fires an alert to Alertmanager. Common alerts include high pod restart counts, node resource pressure, persistent volume capacity warnings, and application error rate thresholds. Alertmanager groups related alerts, suppresses duplicates, and routes notifications to the right team.
This approach is architecture-driven rather than a limitation. The model gives you more programmable and version-controlled alerting than GUI-defined policies, because rules live as code in Git and ship through the same pipelines as the rest of your platform configuration. You write alerting rules as code, store them in version control, and deploy them through the same GitOps pipeline as your application configuration. Alert definitions become part of your infrastructure-as-code practice, auditable and reproducible across clusters.
VMware Live Recovery provides integrated disaster recovery for VCF environments. It includes VMware Live Site Recovery (formerly Site Recovery Manager) for automated failover orchestration, vSphere Replication for hypervisor-based VM replication, and vSAN Data Protection for local and remote snapshots. Starting with VMware Live Recovery 9.0.3, the on-premises components ship in a single unified appliance. Recovery plans define VM startup order, network reconfiguration, and custom scripts for automated failover to a secondary site.
Kubernetes backup and disaster recovery requires a different approach because the unit of protection changes. In VMware, you protect VMs and their associated VMDK files. In Kubernetes, you protect two distinct layers, cluster state (the resource definitions stored in etcd) and persistent data (the volumes attached to stateful workloads).
Velero is the most widely adopted open-source tool for Kubernetes backup and restore. It backs up Kubernetes resource definitions and persistent volume data to object storage (S3, Azure Blob, Google Cloud Storage). Velero supports scheduled backups, namespace-level granularity, and pre/post-backup hooks for application-consistent snapshotsFor enterprise-grade data protection, Portworx Backup (PX-Backup) provides a purpose-built solution for Kubernetes. It understands application context, backs up all Kubernetes objects associated with a workload (deployments, services, secrets, ConfigMaps, PVCs), and restores complete applications to the same or different clusters. Commercial alternatives include Kasten K10 from Veeam and TrilioVault.
Disaster recovery in Kubernetes extends beyond backup and restore. Portworx provides synchronous and asynchronous replication of persistent volumes across clusters and regions. Combined with application-level failover logic, this delivers DR capabilities comparable to vSphere Replication and VMware Live Site Recovery.
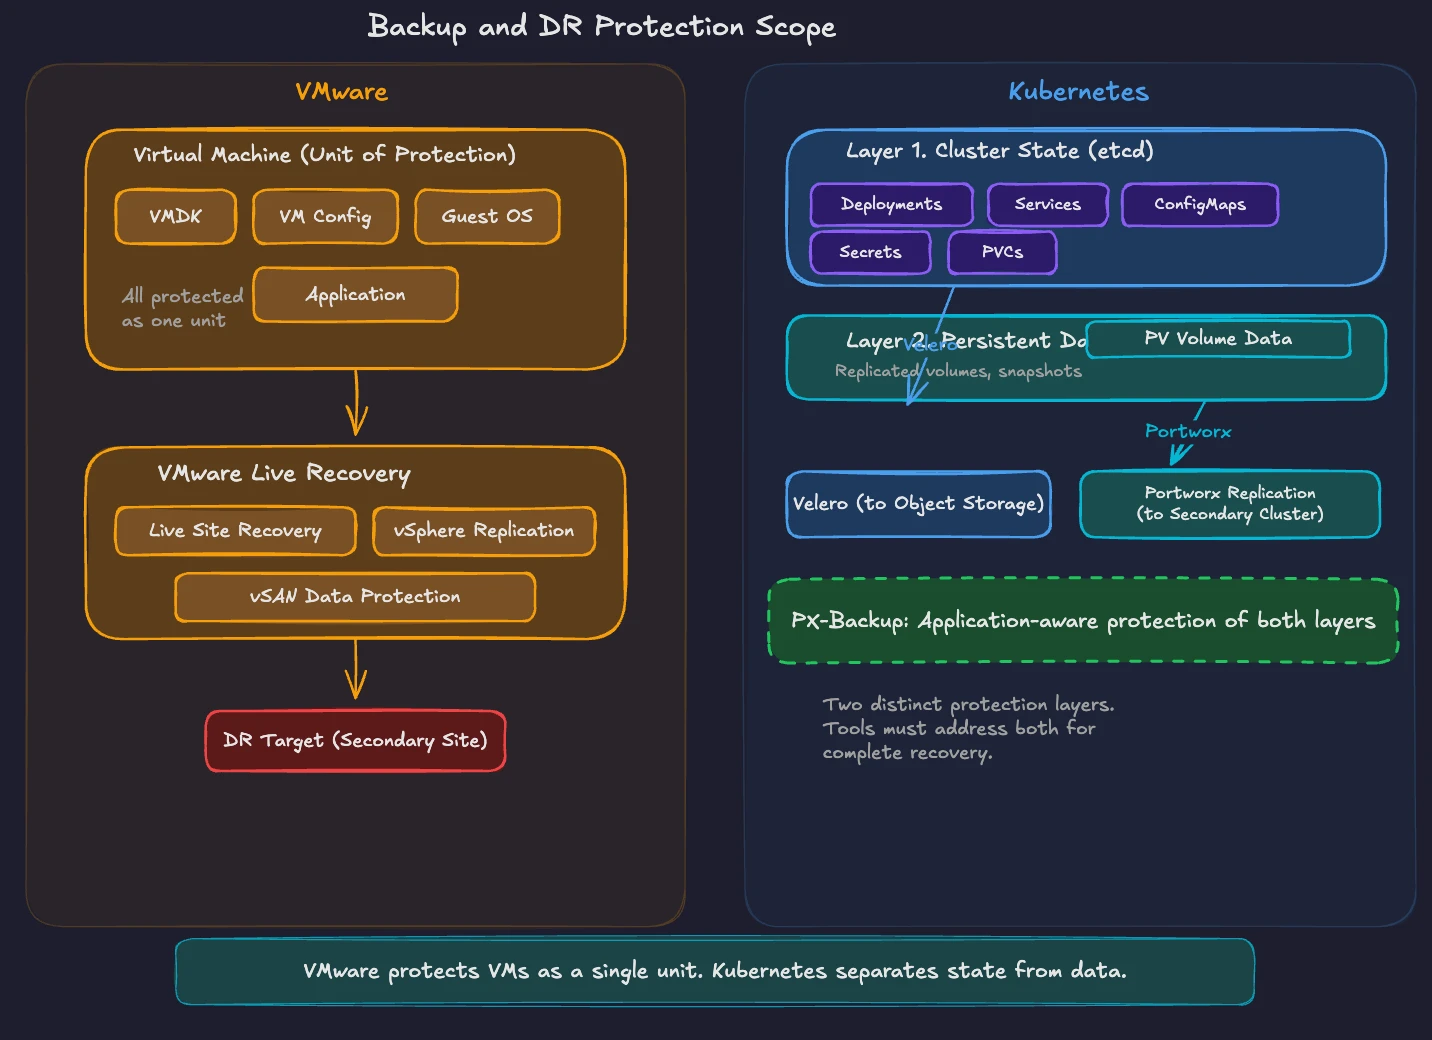
The conceptual mapping is straightforward. VMware Live Recovery orchestrates VM-level failover with defined recovery plans. In Kubernetes, Velero or PX-Backup provides backup and restore, while storage-level replication (Portworx, or cloud-native equivalents) handles continuous data protection. The protection scope shifts from VMs to Kubernetes resources and persistent volumes.
vSphere Lifecycle Manager (vLCM) manages the patching and upgrade lifecycle for ESXi hosts. You define a desired image or baseline, scan hosts for compliance, and remediate non-compliant hosts. vLCM orchestrates rolling upgrades across clusters, evacuating VMs from each host through vMotion before applying updates. The process is well-defined, GUI-driven, and integrated into vCenter.
Kubernetes cluster upgrades follow a different pattern based on versioning policy. Kubernetes releases a minor version roughly every four months (about three per year). Upstream Kubernetes maintains patch releases for the most recent three minor versions, which works out to roughly one year of patch support for a given minor release. The upgrade path requires moving one minor version at a time. You upgrade the control plane components first (API server, controller manager, scheduler, etcd), then upgrade worker nodes.
For self-managed clusters, you coordinate the upgrade across multiple components. kubeadm provides a structured upgrade workflow for clusters bootstrapped with kubeadm. You run kubeadm upgrade plan to check available versions, kubeadm upgrade apply to upgrade the control plane, then drain and upgrade each worker node individually.
Managed Kubernetes services (EKS, AKS, GKE) simplify this process. The provider handles control plane upgrades. You manage node pool upgrades, which typically roll new nodes into the pool and drain old ones.
The maintenance window concept differs significantly. In VMware, vMotion enables zero-downtime host maintenance. You put a host in maintenance mode, VMs migrate to other hosts, and workloads continue running. Kubernetes uses a similar approach through pod disruption budgets and node draining. When you drain a node, Kubernetes evicts pods according to disruption budget rules, and the scheduler places them on other available nodes. Applications with proper replica counts and disruption budgets experience zero downtime during node maintenance.
Cluster upgrades also include addon and operator updates. The monitoring stack, CNI plugin, storage drivers, and ingress controllers all have independent release cycles. Tools like Helm and GitOps controllers (Argo CD, Flux) manage these component upgrades declaratively. You define the desired version in your Git repository, and the GitOps controller applies the update to the cluster.
For VMware administrators, think of Kubernetes cluster upgrades as a more modular version of vLCM remediation. Instead of a single host image, you manage versions for the control plane, node OS, container runtime, and every cluster addon independently. The tradeoff is more flexibility and control, with more components to track.
The fundamental difference in Day 2 operations between VMware and Kubernetes is the shift from integrated platforms to composable toolchains. VMware delivers monitoring, logging, backup, and lifecycle management as tightly integrated products within VCF. Kubernetes gives you building blocks and the freedom to assemble them. Rather than relying on a preset operational and automation model, teams can integrate best-of-breed tools at their own pace and evolve their platform without being locked into a single vendor’s ecosystem.
This shift mirrors the broader ClickOps-to-GitOps transition introduced in Part 1 of this series. Your monitoring configuration, alerting rules, backup schedules, and upgrade definitions live in Git repositories. Changes go through pull requests. Deployments happen automatically. The operational infrastructure becomes code, version-controlled and auditable.
Your VMware operations experience provides the foundational knowledge for Kubernetes Day 2 management. You understand why monitoring matters. You know the importance of centralized logging. You recognize the criticality of tested backup and recovery procedures. You appreciate the discipline of planned maintenance windows. Apply these principles to the Kubernetes toolchain, and you will build a production-grade operational practice.
Chapter 9 covers the migration journey. You will learn practical frameworks for assessing your VMware estate, categorizing workloads, building a platform team, and planning a phased transition to Kubernetes.
Chapter 1: From ClickOps to GitOps: Why the Paradigm Is Shifting
Economic pressure, operational philosophy changes, and what this means for VMware professionals.
Chapter 2: KubeVirt: Running Virtual Machines in a Kubernetes World
How VMs and containers coexist—and why KubeVirt is the practical bridge forward.
Chapter 3: Mapping the Stack: From VMware SDDC to Cloud-Native Architecture
A mental model that translates vSphere, vSAN, and NSX into Kubernetes equivalents.
Chapter 4: Compute Reimagined: ESXi Hosts vs Kubernetes Nodes
How scheduling, abstraction, and control planes differ between hypervisors and Kubernetes.
Chapter 5: Storage Evolution: From Datastores to Persistent Volumes
Translating vSAN concepts into container-native storage and CSI-driven architectures.
Chapter 6: Networking Translated: NSX and the Kubernetes Networking Model
CNI plugins, services, ingress, and service meshes explained for VMware practitioners.
Chapter 7: Security Models Compared: vSphere Security vs Kubernetes Security
RBAC, isolation, policy enforcement, and shared responsibility in a cloud-native world.
Chapter 8: Day 2 Operations: Monitoring, Lifecycle, and Reliability
How observability, upgrades, backup, and DR work once Kubernetes is in charge.
Chapter 9: Planning the Migration: From VMware Estate to Kubernetes Platform
Assessment frameworks, migration strategies, team structure, and common pitfalls.
Chapter 10: Beyond Migration: Building a Cloud-Native Operating Model
Platform engineering, GitOps, extensibility, and preparing for what comes next.