

Open Source
Is KubeVirt Ready for Your Production Workloads?

Summarize Blog With
Table of Content
Benchmark KubeVirt Performance with Metrics that Matter to VMware vSphere Admins
Moving virtual machines to Kubernetes requires more than just functional validation. Portworx’® new open-source toolkit gives platform engineering teams the tools to stress-test KubeVirt at scale using the metrics relevant for VMs.
Among organizations facing the “Broadcom® tax”, there’s an increasing interest in migrating some or all of the VM estate from traditional hypervisors to KubeVirt. While KubeVirt manages VMs like pods, it introduces a new set of performance variables. You’re no longer just dealing with CPU and RAM; you’re dealing with the Kubernetes scheduler, CSI (Container Storage Interface) provisioner, and SDN overlay overhead.
For platform engineers, “it works in my lab” isn’t enough. Among other things, you need to know:
- Time-to-Ready: Not just when the pod starts, but when the VM is fully ready.
- Burst Capacity: How the control plane handles 100 concurrent VM creation requests (e.g., a boot storm).
- Day-2 Operations: Metrics like the exact network latency during live migration.
To answer these questions quantitatively, Portworx is pleased to release the KubeVirt Performance Benchmarking Toolkit, which you can obtain from the repository. This open-source framework enables you to execute reproducible stress tests against any KubeVirt-enabled cluster.
Why We Created the Benchmark
Kubernetes was originally built for apps that run in containers which can spin up in milliseconds and handle failure by simply restarting. But virtual machines have strict infrastructure requirements familiar to vSphere experts, and standard Kubernetes primitives don’t naturally measure these.
“Ready” Means Different Things for Pods and VMs
A pod is considered ready as soon as the process starts, often in sub-seconds. A VM isn’t ready until the OS boots, services start, and VMware® monitoring tools report a heartbeat. A standard Kubernetes metric reporting “pod running” may be misleading because the guest OS might still be starting up.
Virtual Hardware Density (VMDKs vs. PVCs)
Production VMs are heavy relative to containers. For example, a database VM often requires a boot disk, a swap disk, and multiple high-performance vDisks attached to a single instance. Standard container benchmarks rarely stress the storage subsystem’s ability to hot plug virtual disks simultaneously. Our benchmark simulates these multi-disk VMs to ensure your environment can handle the complex block-device attachments you’re used to managing with VMX configurations.
Migration Differences
If a node fails, Kubernetes kills the pod and restarts it on another node. vSphere admins rely on VMware vMotion® and the VMware Distributed Resource Scheduler® (DRS) to move running memory states between hosts.
KubeVirt performs live migration, but it relies on the overlay network rather than a dedicated TCP/IP stack. Our toolkit explicitly tests the stun time to validate that your KubeVirt migrations are as seamless as the vMotion migrations you rely on today.
Because of these fundamental architectural differences, standard Kubernetes observability tools can give you a green light even when your VMs would be performing poorly by vCenter metrics. By using our KubeVirt-specific benchmarking suite, you move beyond simple pod metrics and start measuring the things that your virtualized workloads actually depend on.
Measuring True Readiness
As you design your virtualization platform on Kubernetes, you can’t rely on best effort performance. Instead, you need reproducible baselines. By integrating virtbench (a kubectl-like CLI) into your staging pipelines, you can validate that infrastructure changes, whether upgrading your storage array, changing CNIs, or updating Kubernetes versions, don’t degrade the performance of your VMs.
Most Kubernetes benchmarks stop the clock when a pod reaches the running state. But for virtualization, a running VM pod simply means that the KVM and QEMU processes have started. Meanwhile, the guest OS typically hasn’t even loaded the kernel yet.
Our framework uses a client-side orchestration model with an in-cluster helper.
- Orchestration: The CLI triggers VM creation via the Kubernetes API.
- Lifecycle Tracking: It tracks the transition from Pending → Scheduled → Bound → Running.
- Network Validation: It utilizes a dedicated ssh-test-pod inside the cluster to continuously ping the new VMs.
- Completion: The timer only stops when network connectivity is established.
Architecture Overview
- Control Plane (CLI): The entry point is the user interacting with the virtbench CLI, which is built on the click framework to manage commands and arguments.
- Benchmark Engines: The CLI drives four distinct benchmark modules that correspond to the testing scenarios:
- DataSource Clone: Handles VM creation and boot storm testing.
- Migration: Manages live migration performance tests.
- Capacity: Tests cluster limits and storage scaling.
- Failure Recovery: Executes FAR (Fence Agents Remediation) node recovery tests.
- Execution Layer: These modules utilize shared utilities and a kubectl wrapper to abstract subprocess execution and command logic.
- Infrastructure Target: The tool interacts directly with the Kubernetes API to manipulate KubeVirt resources (VMs, VMIs, DataVolumes) and the storage layer (PVCs, snapshots) across the cluster’s worker nodes.
- Reporting: The tool captures performance metrics and exports them into JSON and CSV formats. These are used to generate an interactive HTML dashboard for visualization and analysis.
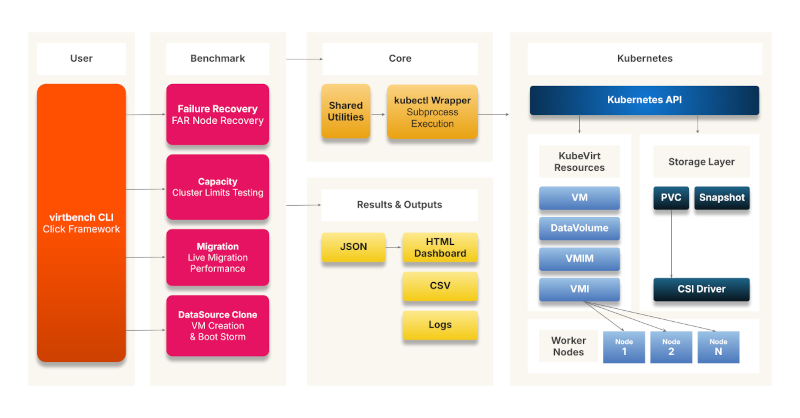
Figure 1: KubeVirt Performance Testing Architecture
Testing Scenarios
The benchmark provides six ready-made scenarios for testing VM health and performance.
DataSource-Based VM Provisioning
Tests the efficiency of VM provisioning using KubeVirt DataSources/DataVolumes, specifically focusing on storage cloning and volume creation times.
Single Node Boot Storm
Validates the performance of a single node when multiple VMs are powered on simultaneously, stressing local node resources.
Multi-Node Boot Storm
Evaluates cluster-wide startup performance by powering on multiple VMs simultaneously across all nodes. This simulates recovery scenarios like power outages or post-maintenance restarts.
Live Migration
Measures the performance of moving running VMs between nodes without downtime. It supports both sequential and parallel migration tests to validate maintenance, load balancing, and disaster recovery operations.
Chaos Benchmark
Runs chaos operations (VM creation, volume resize, volume clone, VM restart, snapshots) with configurable concurrency. Use high concurrency to stress-test storage resilience under parallel workloads, or concurrency=1 for sequential capacity benchmarking.
Failure and Recovery
Validates High Availability (HA) capabilities by simulating node failures using Fence Agents Remediation. The tool measures the time required for VMs to recover and become operational again.
A full description of the testing scenarios, prerequisites, and command structures is available in the repository.
Visualizing Scale with the Performance Dashboard
Data is only useful if it tells a story. The KubeVirt Benchmark Toolkit includes a dashboard that visualizes your cluster’s performance characteristics across different scaling scenarios.
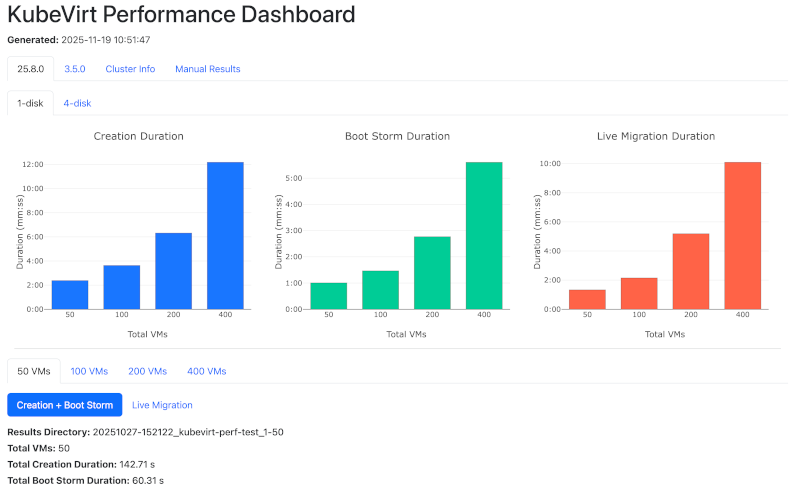
Figure 2: Performance Dashboard (simulated results)¹
In the screenshot above, you see a stress test running against a set of VMs.
- The Blue Chart (Creation Duration): Establishes your baseline. It shows the linear time required to provision VMs under normal conditions.
- The Green Chart (Boot Storm): This visualizes the “herd effect,” revealing when your storage backing or Kubernetes control plane begins to saturate under the pressure of many simultaneous boot requests.
- The Orange Chart (Live Migration): This tracks how long it takes to evacuate nodes at scale. Use these metrics for planning maintenance windows without disrupting workloads.
The dashboard also provides the granular data needed to debug those performance curves. The Creation Summary table breaks down the total time into specific phases:
- Clone Duration: Is your storage array slowing down during the copy process?
- Running Time: Is the Kubelet struggling to start containers?
- Ping Time: Verifies the length of time it takes for a VM to be network-accessible.
This dashboard enables platform engineers to present hard evidence to stakeholders about capacity limits and readiness.
Where Does This Benchmark Fit in the KubeVirt Ecosystem?
The KubeVirt community has built a variety of tools for testing and observability. You may wonder, “How is this different from kube-burner or other standard benchmark scripts?” While existing tools are excellent for specific domains, Portworx built this framework to fill a gap in end-to-end lifecycle orchestration.
kube-burner
kube-burner stress tests the Kubernetes control plane. It generates object churn to test etcd and scheduler limits. Our toolkit focuses on the data path and user experience. We don’t just measure how fast the API accepts the request; we measure the downstream effects: storage cloning speeds, OS boot times, and network accessibility.
kubevirt/test-benchmarks (fio/iperf)
Tools that wrap fio or iperf micro-benchmark specific resources (e.g., “How many IOPS can this disk push?”). We focus on the interaction of components. For example:
- We don’t just test raw network bandwidth. Instead, we test how the network performs during a live migration event.
- Likewise, we don’t just test disk write speed. We want to know how fast we can clone a 50GB golden image during a boot storm.
In a future release, we will also include tools to download fio inside a virtual machine for I/O benchmarking.
Integration Tests
Standard KubeVirt E2E tests are binary: Did it pass or fail? The KubeVirt Performance Benchmarking Suite is quantitative, answering “How long did the operation take?” It’s designed to surface performance issues before they reach production.
Validate Your KubeVirt Workloads with Data-Driven Rigor
Migrating workloads from vSphere to KubeVirt is a significant architectural shift. By establishing reproducible baselines for situations like boot storms, live migration, and recovery, you can navigate this transition with data-backed confidence. Try out the KubeVirt Performance Benchmarking Toolkit and develop a more complete picture of VM health and performance!
¹The performance results reflect a specific configuration in our lab and should not be interpreted as indicators of system scale in customer environments.
Portworx is a registered trademark of Pure Storage, Inc.
Broadcom, VMware, VMware vCenter, VMware vSphere, VMware vMotion, and the VMware Distributed Resource Scheduler are registered trademarks or trademarks of Broadcom, Inc., VMware, Inc., or their subsidiaries in the United States and/or other jurisdictions.
Recommended for you